
Technical Analysis for US Dollar, S&P 500, Gold and Crude Oil - Price to breaking 1200 for Gold, Crude Oil is below three-week-old trend line

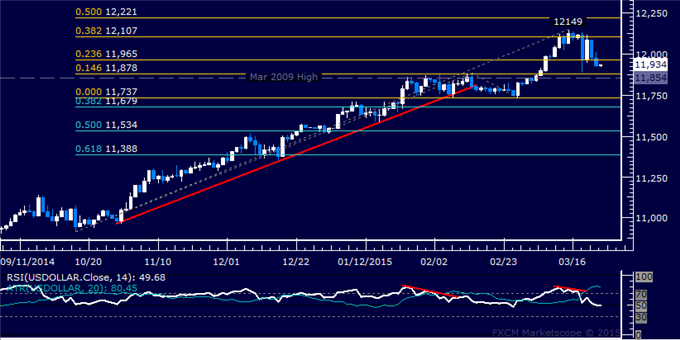
US DOLLAR TECHNICAL ANALYSIS
Prices turned lower as expected,
with a break of chart support pointing to further weakness ahead. A
daily close below the 11854-78 area (March 2009 high, 14.6% Fibonacci
expansion) exposes the 11679-737 region (February 26 low, 38.2% Fib
retracement).
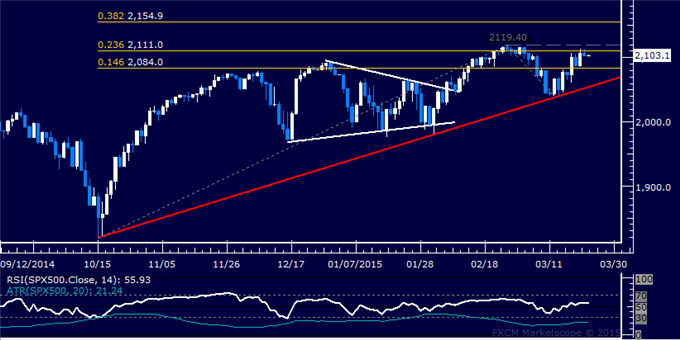
S&P 500 TECHNICAL ANALYSIS
Prices have returned to
challenge record highs. A daily close above the 2111.00-19.40 area
(23.6% Fibonacci expansion, February 25 high) exposes the 38.2% level at
2154.90.
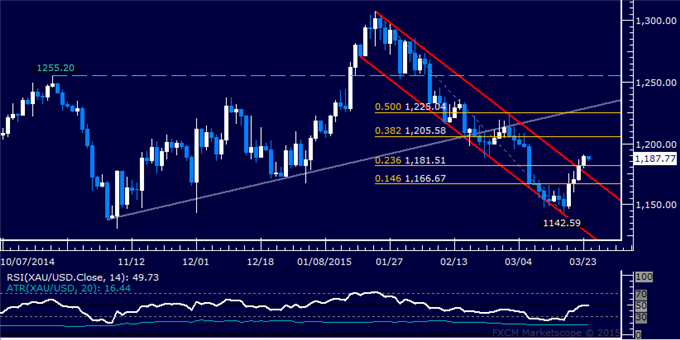
GOLD TECHNICAL ANALYSIS
Prices look poised for another move
above the $1200/oz figure. A break above the 38.2% Fibonacci retracement
at 1205.58 exposes the 50% level at 1225.04. Alternatively, a turn
below the 23.6% Fib at 1181.51 targets channel top
resistance-turned-support at 1173.39.
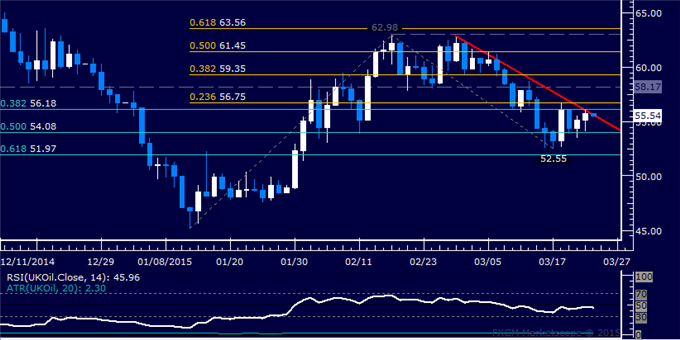
CRUDE OIL TECHNICAL ANALYSIS
Prices continue to digest below
three-week-old trend line resistance. A break below the 50% Fibonacci
retracement at 54.08 exposes the 51.97-52.55 area (March 17 low, 61.8%
level). Alternatively, a push above the 23.6% Fib expansion at 56.75
targets support-turned-resistance at 58.17.


")
")