
Technical Analysis for US Dollar, S&P 500, Gold and Crude Oil - Gold Digesting at 1200 Mark

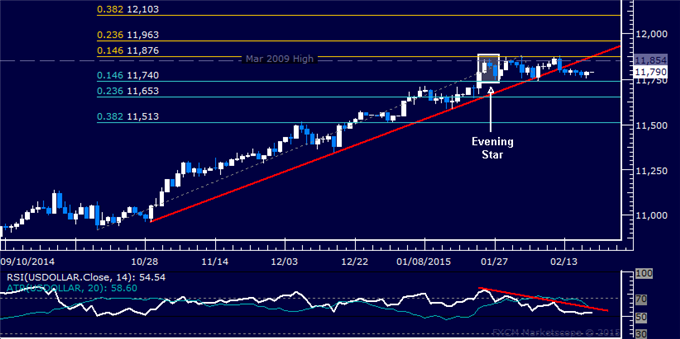
US DOLLAR TECHNICAL ANALYSIS
Prices look to have reversed
downward as expected after putting in a bearish Evening Star candlestick
pattern. A daily close below the 14.6% Fibonacci retracementat 11740
exposes the 23.6% level at 11653.
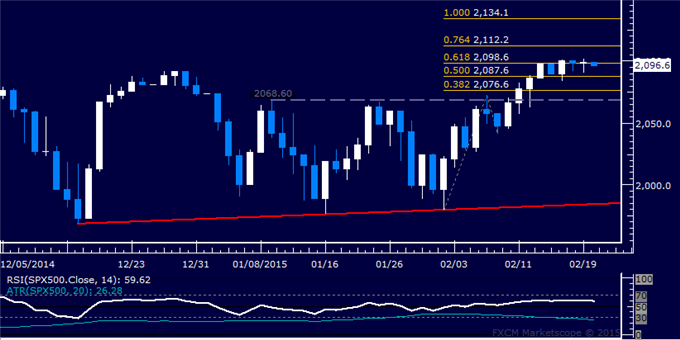
S&P 500 TECHNICAL ANALYSIS
Prices appear poised to continue
upward after setting another record high. A break above the 76.4%
Fibonacci expansion at 2112.20 exposes the 100% level at 2134.10.
Alternatively, a reversal below the 61.8% Fib at 2098.60 targets the 50%
expansion at 2087.60.
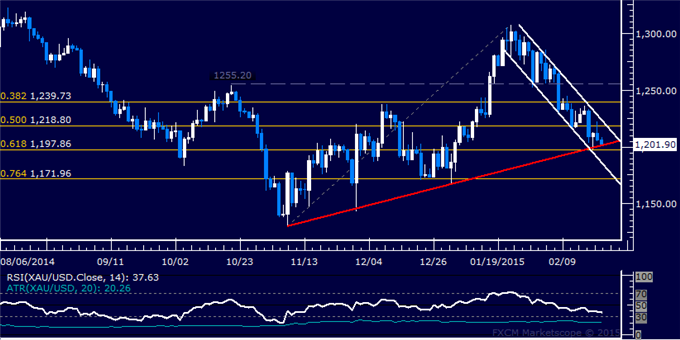
GOLD TECHNICAL ANALYSIS
Prices challenging pivotal support at
1197.86, marked by the intersection of a channel floor, a rising trend
line and the 61.8% Fibonacci retracement. A break below this barrier
exposes the 76.4% level at 1171.96. Alternatively, a reversal above the
50% level at 1218.80 targets channel top resistance at 1227.65.
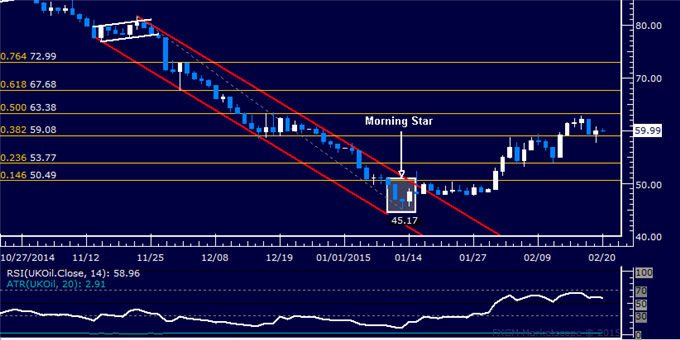
CRUDE OIL TECHNICAL ANALYSIS
Prices corrected lower after
reversing upward as expected. A break back below the 38.2% Fibonacci
retracement at 59.08 exposing the 23.6% level at 53.77. Alternatively, a
break above the 50% Fib at 63.38 targets the 61.8% retracement at
67.68.


")

![[XAUUSD]: Weekly Liquidity Activation Points (timings), June 22-26, 2026](https://c.mql5.com/6/1013/splash-preview-771790.png "[XAUUSD]: Weekly Liquidity Activation Points (timings), June 22-26, 2026")