

Finding a strong directional move is the first priority of any trend trader. However, when having to select a currency pair to trade, it can be difficult to identify the best trends. For the ADX 50 strategy we will be using the ADX (Average Directional Index) indicator for this process. First, add a 14 period ADX to the 4Hour chart, using Daily periods.
Remember, ADX is not identifying the direction of the trend, only its
intensity. If a currency pair’s trend is weak or if the pair is
consolidating, ADX will read significantly lower than a strong
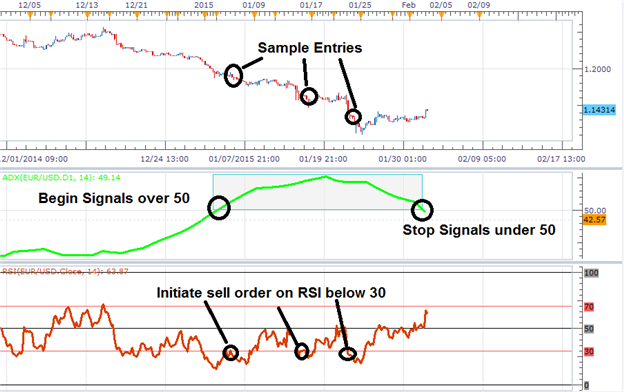
directional market. For the ADX 50 strategy, we will only be looking
for currency pairs with an ADX value of over 50! If Daily ADX reads over
50, you can then begin to move to the execution phase of the strategy.
Once a strong trend is found, it is time to plan an entry into the
market. The ADX 50 trend trading strategy uses an RSI (Relative
Strength Index) indicator with a 14 period setting on a 4Hour chart.
In a downtrend, new sell positions should be entered only when ADX reads
over 50 and RSI closes below 30 (oversold). Conversely buy positions
will be initiates when ADX reads over 50 and RSI closes above 70.
Traders should always have a plan for managing their position.
Eventually trends will come to an end and any existing trades should be
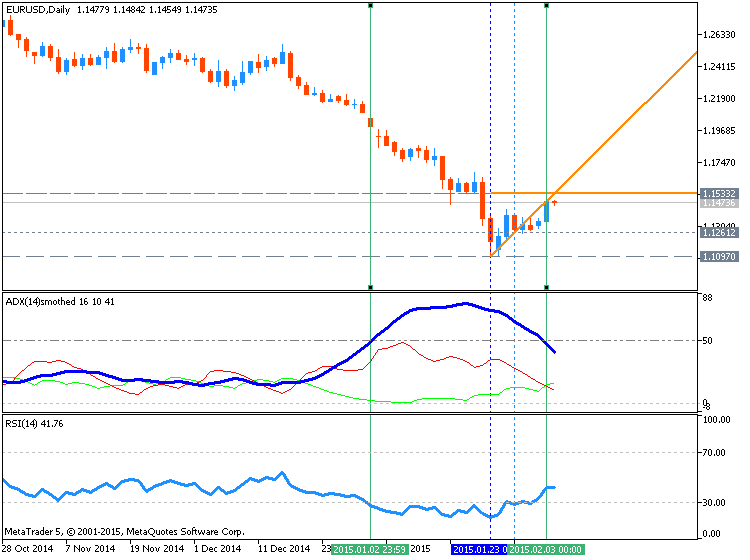
exited. When initiating a buy order, stop orders should be placed at a
14 period low on the 4Hour chart. That way if a new low is created, all
existing buy trades will be closed. Conversely if a trader is selling in
a downtrend, stops can be placed at a 14 period high again using the
4Hour chart.


