
Technical Analysis for US Dollar, Crude Oil, S&P 500 and Gold - Crude Oil Range Holds, Gold Snaps Monthly Uptrend

US DOLLAR TECHNICAL ANALYSIS
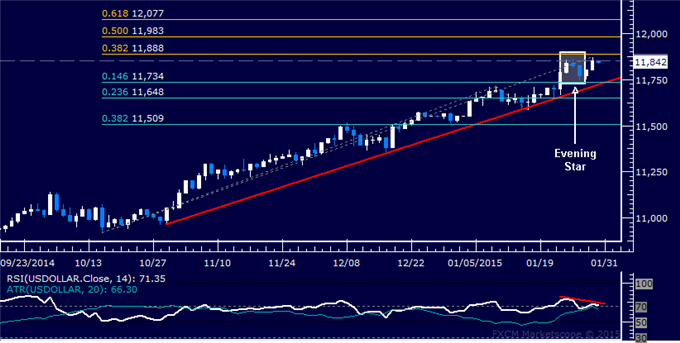
Prices may be preparing to decline
after prices put in a bearish Evening Star candlestick pattern.
Negative RSI divergence bolsters the case for a downside scenario.
Near-term support is at 11734, the intersection of the 14.6% Fibonacci
retracement and a rising trend line, with a break below that on a daily
closing basis exposing the 23.6% level at 11648.
S&P 500 TECHNICAL ANALYSIS
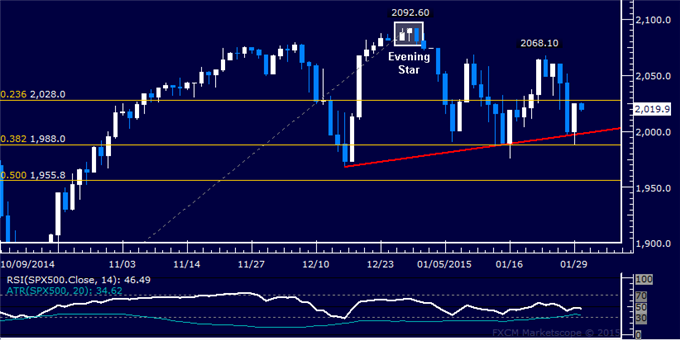
Prices declined as expected
after putting in a bearish Evening Star candlestick pattern. A daily
close below the 1998.00-30 area marked by a rising trend line and the
38.2% Fibonacci retracement exposes the 50% level at 1955.80.
GOLD TECHNICAL ANALYSIS
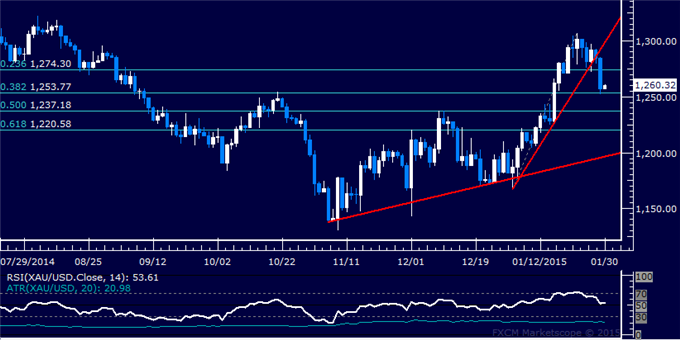
Prices turned sharply lower,
overturning the monthly uptrend. A daily close below the 38.2% Fibonacci
retracement at 1253.77 exposes the 50% level at 1237.18. Alternatively,
a push above the 23.6% Fib at 1274.30 targets trend line
support-turned-resistance at 1299.63.
CRUDE OIL TECHNICAL ANALYSIS
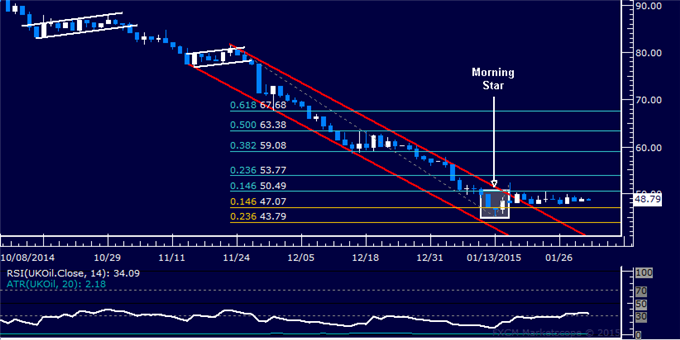
Prices are stalling having
attempted to recover as expected. A daily close above the 14.6%
Fibonacci retracement at 50.49 exposes the 23.6% level at 53.77.
Alternatively, a reversal below the 14.6% Fib expansion at 47.07 targets
the 23.6% threshold at 43.79.


")

