

SUPPORT RESISTANCE EA USER GUIDE
I do not guarantee any financial profits using this EA! As with any Expert Advisor, this can also cause financial losses in unfavorable market conditions.
Broker: It's important for this strategy to have a low cost broker. The broker I've used for the backtests is IC Trading.
INPUT PARAMETERS
The input parameters are explained here:
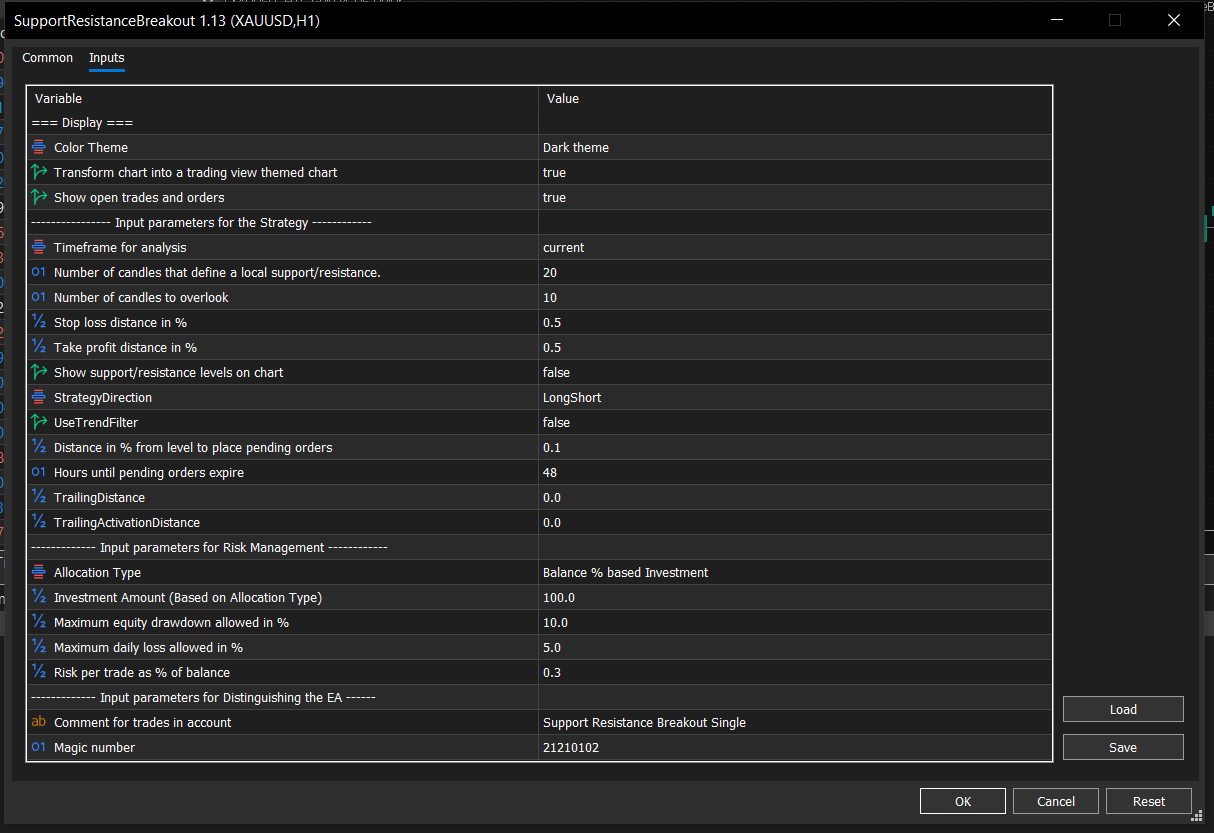
Display Inputs
- Theme: Set the chart to the theme you want.
- Tradingview Chart style: The chart will be transformed based on your selected theme
- Show open trades and orders: You will see the trades & orders placed by the strategy on the chart.
Strategy Inputs
- TimeFrame: This will be the TimeFrame used for the detection of Support and Resistance levels. My recommendation for this input parameter is to use something above 1 Hour.
- Period: This is the number of candles that define a local support/resistance. If this is 20 for example, the search for a resistance will happen in the last 20 candles.
- Overlook: This is the number of inferior candles before the local support/resistance. If this is 10 for example, and a Resistance is found at the 20th candle, there shouldn't be any candle in the next 10 candles (so from 20-30) that surpasses the resistance.
- Stop Loss percentage: This will be the SL used for each trade. The reason why this input parameter is in percentage, and why the following parameters will be explained in the FAQ section.
- Take Profit percentage: This will be the TP used for each trade.
- SR Display: If you want to see the current support and resistance levels on your chart you can do so by setting this parameter to true.
- Strategy Direction: You can choose to allow Buy & Sell, or only Buy or only Sell trades by the strategy.
- Use Trailing Stop: If you want to use a trailing stop you can set this parameter to true. Otherwise the following 2 parameters are redundant.
- Trailing Stop Distance in percentage: If you use Trailing Stop this will be the percentage by which the SL follows the price.
- Trailing Stop Activation Distance: The trailing stop will only activate after a trade reaches this percentage in profit. If you want immediate trailing stop, set this to 0.
- Stop Order Distance: This distance in terms of percentage of the price will be used for placing orders above/below the support and resistance levels.
- Expiry Hours: The hours until the pending orders expire.
Risk Management (Check out the Architecture paragraph)
- Allocation type: You can either choose to invest a monetary amount into the strategy or a given percentage of your balance.
- Investment Amount: This will be converted into a monetary amount you invest in the strategy. If you choose to invest a percentage of your balance this percentage will be "allocated" to the strategy. If you have a balance of 10000$ and you set this to 25%, the strategy will do as if you had 2500$. You can also choose monetary amount, then setting this value to 2500 would result in the same outcome.
- Maximum Drawdown: The maximal allowed equity drawdown. It's important to note, that this will use the simulated balance specified above. With the example above, if you set this to 20% the maximum drawdown will be (or at least it will try to achieve) 500$
- Maximum Daily Drawdown: The maximal allowed equity drawdown on a single day. Uses the simulated balance as a base.
- Risk Percentage per Trade: The capital risked on each trade will be this percentage of the simulated balance.
Distinguishing the EA
- Comment: The comment the trades will have.
- Magic: The Magic Number the trades will have.
Risk Management Architecture
This EA follows a unique architecture, that is not very common. Usually risk management and lot sizing is done with a simple approach: Use X amount of lots, or use X amount for each 1000$ on your balance. The Risk Management Architecture of Traders Meta is different, for the sake of diversification and simple understanding. This approach allows traders to allocate capital to strategies instead. But it is of utmost importance to understand how it works.
Traders can either set the percentage of the balance or the amount of money used for a given strategy.
For percentage of the balance, the input can be any number from 0% to 100%. The strategy will then calculate a simulated balance for itself. For example if you have a 10k account and your input is 50%, The strategy will "see" 5000$ allocated to it. The profits and losses of the trades the strategy took will be then added to this simulated balance. If the strategy is successful and manages to triple the initial 5k to 15k and now you have 20k in your account, the strategy will have a simulated balance of 15k and will "posess" 75% of your balance instead of 50%. If the strategy fails and loses 2.5k and now you have a balance of 7.5k, your strategy will "posess" only 25% of your balance.
If you select Monetary amount as an allocation method, you can set the exact monetary amount. You would get in this case the same outcome as above if you entered 5000 as an investment amount.
Why is this method better?
It gives access to more capital for successful strategies and takes capital away from failing strategies. The other key aspect is that it leaves room for diversification. It compliments other trading strategies, by letting the trader decide, how much capital each strategy can trade with.
Another key concept is the management of Drawdown.
Two important drawdown limits can be set using this strategy: The overall maximum drawdown and the daily drawdown limit.
If the overall drawdown is reached, the strategy won't open any new trades. If the daily drawdown is reached, the strategy won't open any new trades on the given day.
Both the maximum drawdown limit and daily drawdown limit should be interpreted as the allowed drawdown of the simulated balance.
For example if the strategy made it to 15k and the drawdown limit is set to 10% the strategy will stop at 1.5k drawdown. This will be a 7.5% drawdown of the 20k portfolio, assuming there is 5k the strategy does not use.
The risk percentage of each trade will also take the simulated account balance into account, to calculate the exact desired risk.
RECOMMENDATIONS
Besides having a low cost broker, many other key factors should be addressed.
The first important one is the Instrument the strategy runs on. This is a trend following breakout strategy, so the best assets are the ones that have strong trends. This strategy is not very likely to have good results on mean reverting forex pairs like NZDAUD or AUDCAD or EURGBP. The best option is to optimize for assets like Bitcoin, Gold and Nasdaq.
Another key factor is timeframe. The bigger the timeframe the more important the support and resistance levels and the less the trading costs matter. For this reason I'd recommend using a timeframe of at least 1 Hour.
The backtest results can show extreme profits under some conditions, but it's important to note that backtest results are not accurate and even if they were, past results are not indications of future performance.
For a starting point I'd recommend using the setfiles, on the given assets.
RISK DISCLOSURE


