
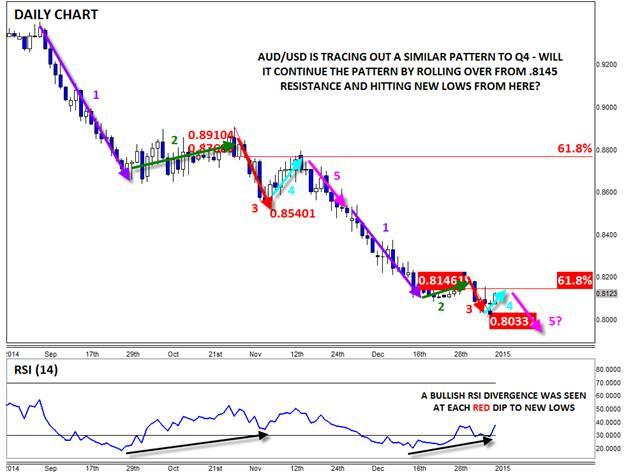
The textbook definition of technical analysis is the use of past market data to help determine what future price action will bring. Because markets are driven by mass trader psychology and emotion, the same types of patterns tend to repeat over time. One simple but potentially effective form of technical analysis is the study of fractals, or repeating price action patterns. As we go to press, AUDUSD is tracing out a compressed version of the same pattern as it did two months ago, and this fractal suggests that the pair may turn lower off key resistance at .8145.
At the start of Q4 last year, AUDUSD….
1) …dropped to a new multi-year low at .8700…
2) …stabilized for a couple of weeks…
3) …fell to a new low, characterized by a clear bullish RSI divergence…
4) …then bounced back to the 61.8% Fibonacci retracement of the recent dip…
5) …before rolling over for good and falling another 700+ pips
In an uncanny similarity to the Q4 price action, AUDUSD, at the beginning of December…
1) …dropped to a new multi-year low at .8100…
2) …stabilized for a couple of weeks…
3) …fell to a new low, characterized by a clear bullish RSI divergence…
4) …and has now bounced back to within striking distance of the 61.8% Fibonacci retracement of the recent dip…
Of course, fractals are not infallible, but if AUDUSD continues to follow its pattern, rates may stall out against the 61.8% Fibo at .8145, clearing the way for another leg down to new 6-year lows under .8000. Conversely, a break above the critical .8145 level would suggest a change in the “character” of the downtrend and could provide an early indication of a more substantial bottom (see my colleague Chris Tedder’s note from earlier this week for more on the bullish fundamental case for AUDUSD). Either way, traders should keep a close eye on .8145 ahead of the weekend and early next week.


