Technical Price Pattern Analysis for US Dollar, Gold, Crude Oil and S&P 500 - Crude Oil at Risk of Deeper Losses, Gold Prices Aim Higher

US DOLLAR TECHNICAL ANALYSIS
Prices have flat-lined after
hitting a five-year high, with negative RSI divergence warning a
downturn may be ahead. Near-term resistance is at 11577, the 38.2%
Fibonacci expansion, with a break above that on a daily closing basis
exposing the 50% level at 11648.

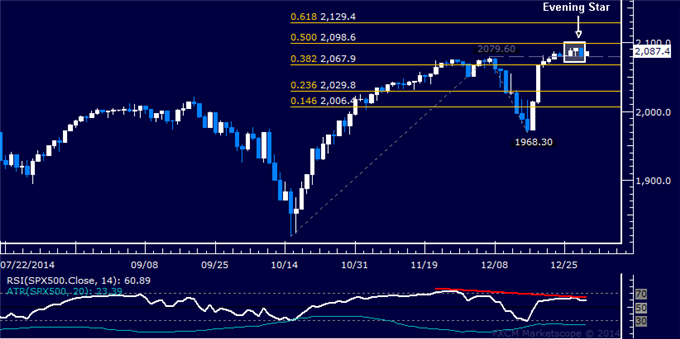
S&P 500 TECHNICAL ANALYSIS
Prices have produced a bearish
Evening Star candlestick pattern, hinting a move lower is ahead.
Negative RSI divergence reinforces the case for a downside scenario. A
daily close below the 2067.90-79.60 area marked by the December 5 high
and the 38.2% Fibonacci expansion exposes the 23.6% level at 2029.80.
Alternatively, a push above the 50% Fibat 2098.60 targets the 61.8%
expansion at 2129.40.
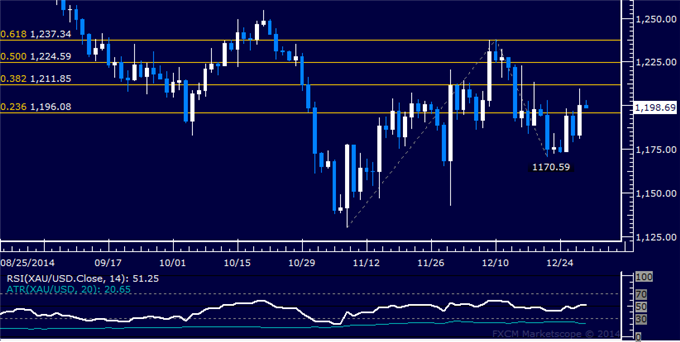
GOLD TECHNICAL ANALYSIS
Prices pushed higher anew after a brief
respite, clearing resistance marked by the 23.6% Fibonacci expansion at
1196.08. Buyers now aim to challenge the 38.2% level at 1211.85, with a
break above that on a daily closing basis exposing the 50% Fib at
1224.59. Alternatively, a reversal back below 1196.08 targets the
December 22 lowat 1170.59.
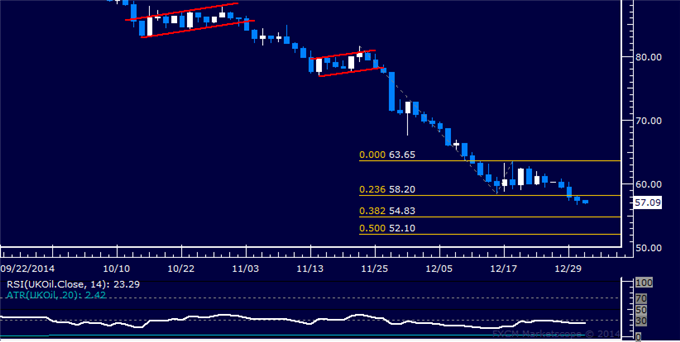
CRUDE OIL TECHNICAL ANALYSIS
Prices are aiming to extend losses
after breaking support at 58.20, the 23.6% Fibonacci expansion. Sellers
now aim to challenge the 38.2% level at 54.83, with a further push
beneath that targeting the 50% Fib at 52.10. Alternatively, a reversal
back above 58.20 aims for the December 18 high at 63.65.