
Price Pattern Analysis for US Dollar, S&P 500, Gold and Grude Oil - Gold Stalls After Breakdown, Crude Oil in Digestion Mode

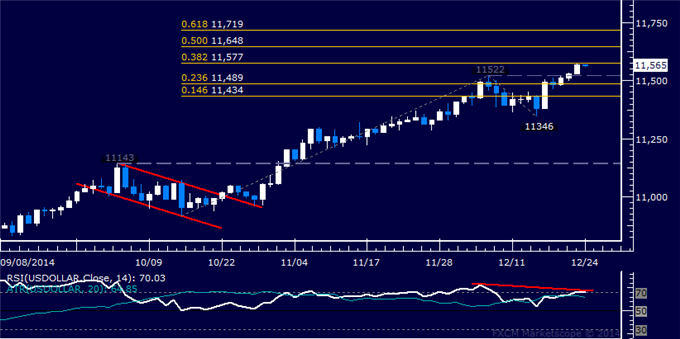
US DOLLAR TECHNICAL ANALYSIS
Prices pushed higher for a third
consecutive day but negative RSI divergence casts doubt on
follow-through. A daily close above the 38.2% Fibonacci expansionat
11577 exposes the 50% level at 11648.
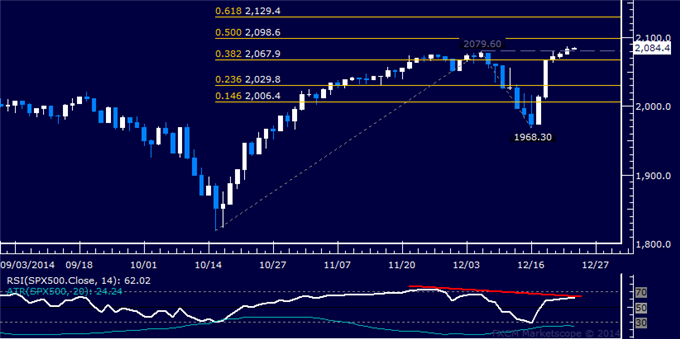
S&P 500 TECHNICAL ANALYSIS
Prices edged above the December 5
high at 2079.60, exposing the 50% Fibonacci expansion at 2098.60. A
daily close above this barrier exposes the 61.8% level at 2129.40.
Negative RSI divergence warns of ebbing upside momentum and hints a turn
lower may be looming.
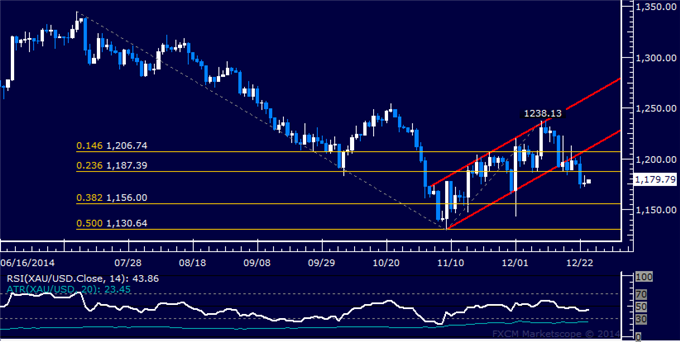
GOLD TECHNICAL ANALYSIS
Prices resumed downward momentum, with
sellers now aiming to challenge the 38.2% Fibonacci expansion at
1156.00. A break below this boundary on a daily closing basis exposes
the 50% level at 1130.64.
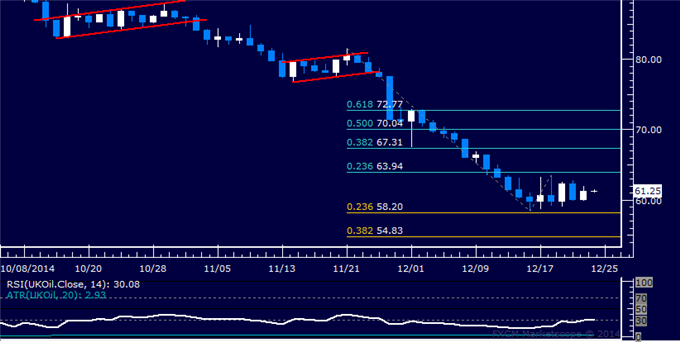
CRUDE OIL TECHNICAL ANALYSIS
Prices are in consolidation mode
above the $58.00/barrel figure. A break below the 23.6% Fibonacci
expansion at 58.20 exposes the 38.2% level at 54.83.


")

")