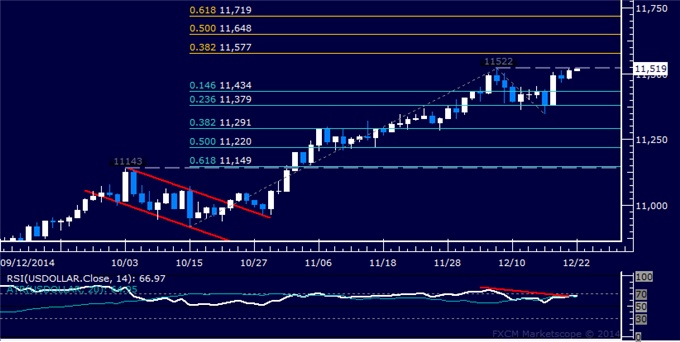
US DOLLAR TECHNICAL ANALYSIS
Prices arestruggling to breach
December’s high, with negative RSI divergence warning a double top may
be forming. A daily close below the 14.6% Fibonacci retracementat 11489
exposes the 23.6% level at 11379.
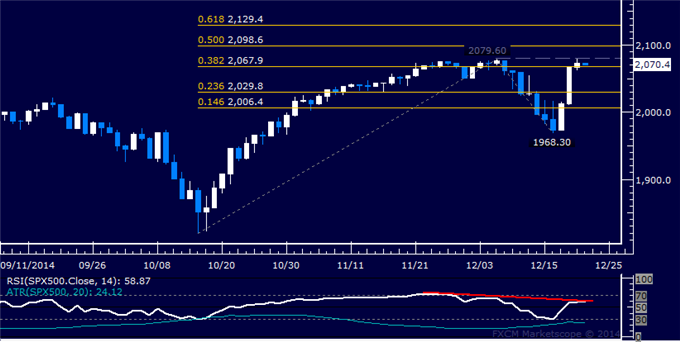
S&P 500 TECHNICAL ANALYSIS
Prices are testing resistance in
the 2067.90-79.60 area marked by the 38.2% Fibonacci expansion and the
December 5 high. A daily close above this barrier exposes the 50% level
at 2098.60. Negative RSI divergence warns of ebbing upside momentum
however and hints a reversal lower may be in the cards. A move below the
23.6% Fib at 2029.80 targets the 14.6% expansion at 2006.40.
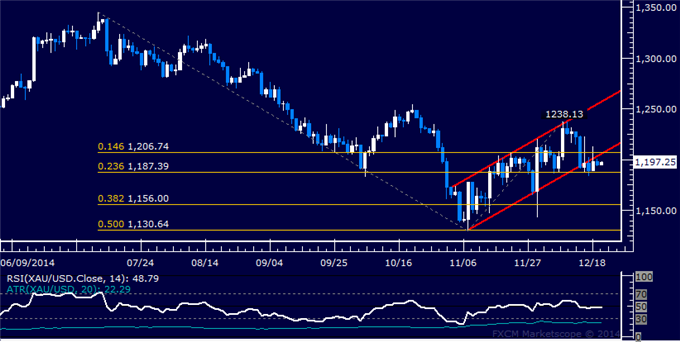
GOLD TECHNICAL ANALYSIS
Prices are struggling with downside
follow-through after breaking support at the bottom of a rising channel
set from early November. A break below the 23.6% Fibonacci expansion at
1187.39 exposes the 38.2% level at 1156.00.
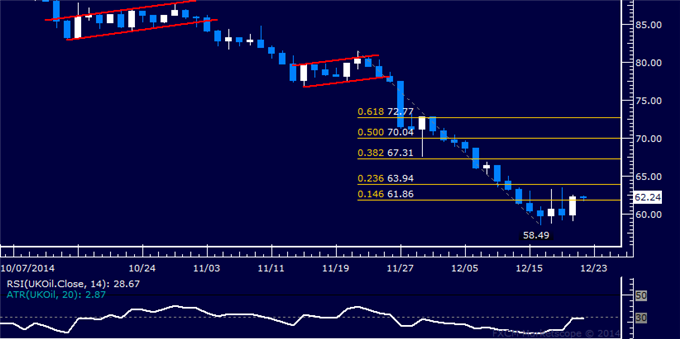
CRUDE OIL TECHNICAL ANALYSIS
Prices put in the largest daily
advance in two months, reclaiming a foothold above the 62.00 figure. A
break above the 23.6% Fibonacci retracement at 63.94 exposes the 38.2%
level at 67.31.