Price Pattern Amalysis for Gold, US Dollar, S&P 500 and Grude Oil: Gold Slips Back Below $1200

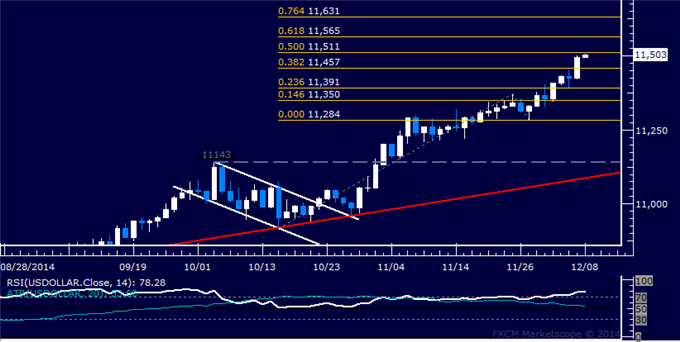
US DOLLAR TECHNICAL ANALYSIS
Prices resumed their advance after a brief respite, putting in the
largest daily advance in five weeks. Near-term resistance is at 11511,
the 50% Fibonacci expansion, with a break above that on a daily closing
basis exposing the 61.8% level at 11565.
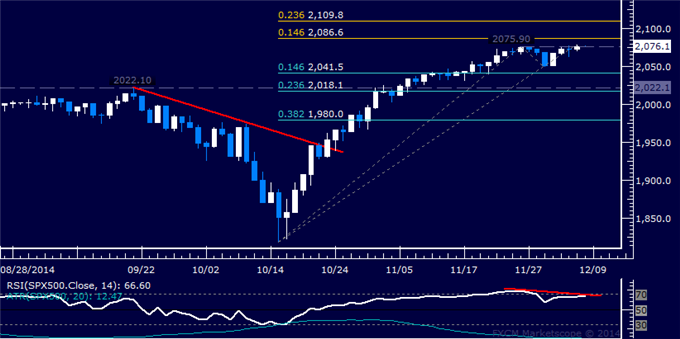
S&P 500 TECHNICAL ANALYSIS
Prices paused to consolidate, with negative RSI divergence warning of
ebbing upside momentum and hinting a turn lower may be ahead. A drop
below the 2041.50-49.10 area marked by the 14.6% Fibonacci retracement
and the December 1 low exposes the 2018.10-22.10 zone.
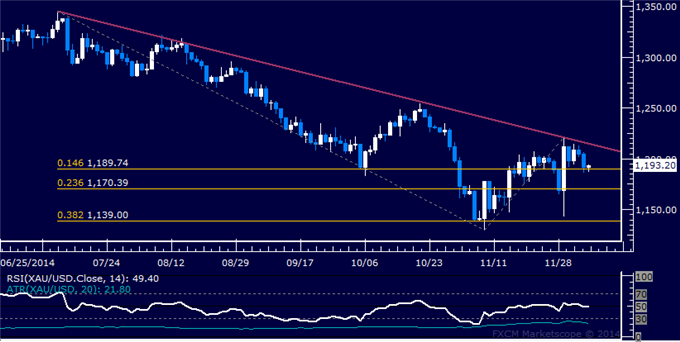
GOLD TECHNICAL ANALYSIS
Prices are turning lower from resistance at a falling trend line set
from early July. A break below the 14.6% Fibonacci expansion at 1189.74
exposes the 23.6% level at 1170.39.
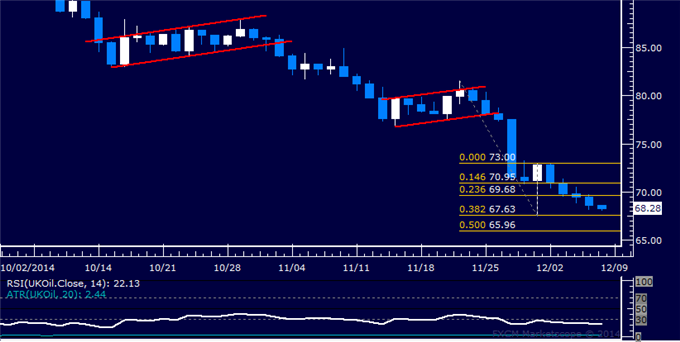
CRUDE OIL TECHNICAL ANALYSIS
Prices look poised to continue lower after breaching support below
the 70.00 figure. A daily close below the 38.2% Fibonacci expansion at
67.63 exposes the 50% level at 65.96.