

US DOLLAR TECHNICAL ANALYSIS
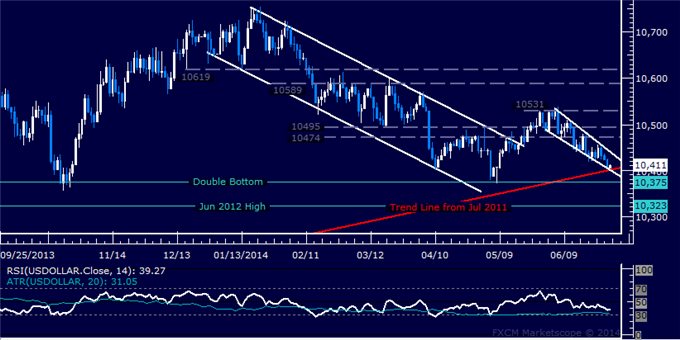
Prices remain in a precarious position as prices continue to hover above multi-year rising trend support set from July 2011. This barrier (now at 10401) is reinforced by a falling Wedge formation bottom. A daily close below that would suggest a major reversal is in progress and initially expose double bottom support at 10375, followed by the June 2012 high at 10323.Wedge resistance is at 10440, with a move above that exposing the 10474-95 cluster. The next topside barrier after that stands at 10531, May 28 high.


")