
Price Pattern Analysis for US Dollar, S&P 500, GOLD and Grude Oil: S&P 500 Technical Positioning Warns a Pullback May Be Coming
8 December 2014, 03:11

0
328
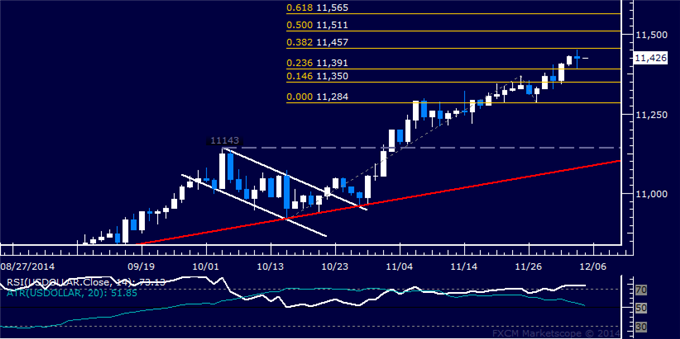
US DOLLAR TECHNICAL ANALYSIS
Prices stalled to consolidate gains after establishing yet another five-year high ahead of the much-anticipated US Employment report. A daily close above the 38.2% Fibonacci expansionat 11457 exposes the 50% level at 11511.
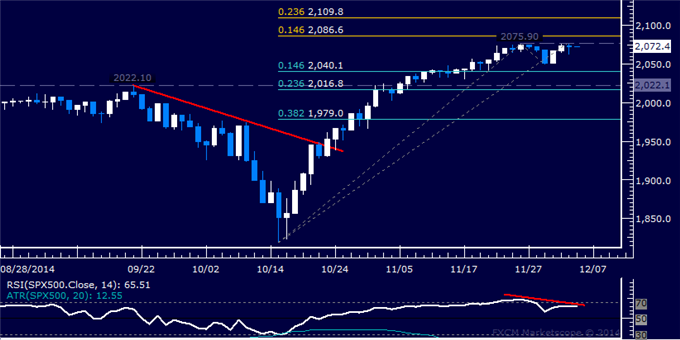
S&P 500 TECHNICAL ANALYSIS
Prices paused to consolidate, with negative RSI divergence warning of ebbing upside momentum and hinting a turn lower may be ahead. A drop below the 2040.10-49.10 area marked by the 14.6% Fibonacci retracement and the December 1 low exposes the 2016.80-22.10 zone (23.6% level, September 19 high).
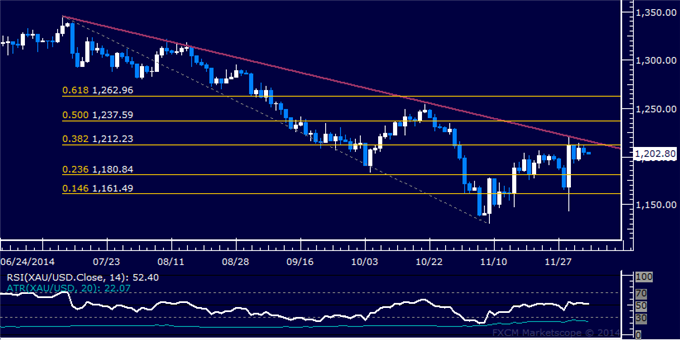
GOLD TECHNICAL ANALYSIS
Prices are in digestion mode below key trend line resistance guiding the down trend since early July. A break above this barrier (now at 1216.16) exposes the 50% Fibonacci retracement at 1237.59.
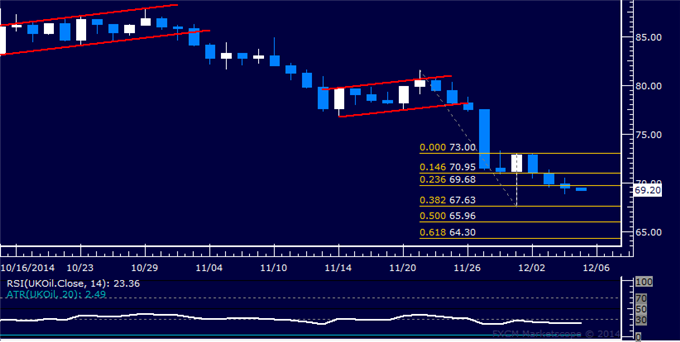
CRUDE OIL TECHNICAL ANALYSIS
Prices look poised to continue lower after breaching support below the 70.00 figure. A daily close below the 38.2% Fibonacci expansion at 67.63 exposes the 50% level at 65.96.
Prices stalled to consolidate gains after establishing yet another five-year high ahead of the much-anticipated US Employment report. A daily close above the 38.2% Fibonacci expansionat 11457 exposes the 50% level at 11511.
S&P 500 TECHNICAL ANALYSIS
Prices paused to consolidate, with negative RSI divergence warning of ebbing upside momentum and hinting a turn lower may be ahead. A drop below the 2040.10-49.10 area marked by the 14.6% Fibonacci retracement and the December 1 low exposes the 2016.80-22.10 zone (23.6% level, September 19 high).
GOLD TECHNICAL ANALYSIS
Prices are in digestion mode below key trend line resistance guiding the down trend since early July. A break above this barrier (now at 1216.16) exposes the 50% Fibonacci retracement at 1237.59.
CRUDE OIL TECHNICAL ANALYSIS
Prices look poised to continue lower after breaching support below the 70.00 figure. A daily close below the 38.2% Fibonacci expansion at 67.63 exposes the 50% level at 65.96.


")
