
HowTo Trade Chart Patterns - Head and Shoulders Bottom Reversal
30 November 2014, 21:11

0
550
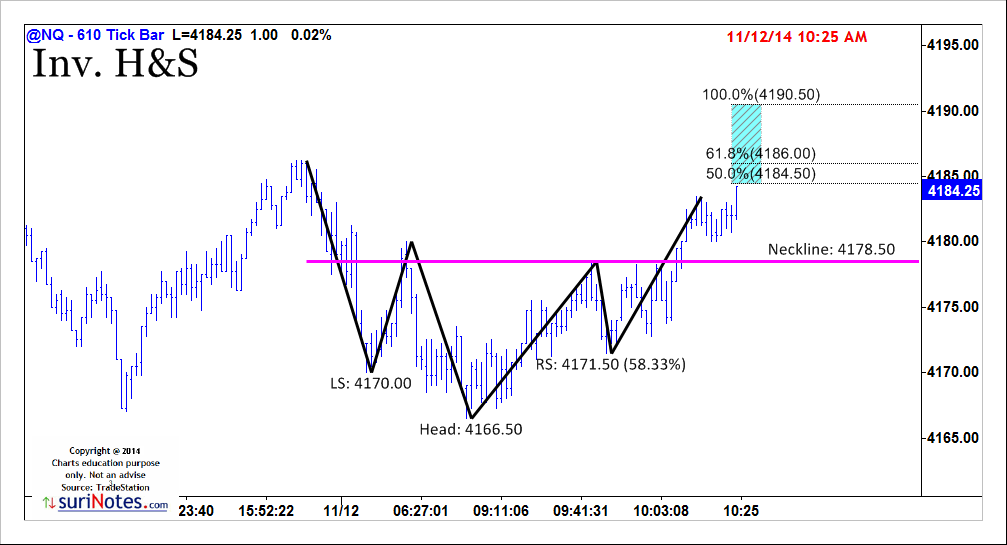
As a major reversal pattern, the Head and Shoulders Bottom forms after a
downtrend, and its completion marks a change in trend. The pattern
contains three successive troughs with the middle trough (head) being
the deepest and the two outside troughs (shoulders) being shallower.
Ideally, the two shoulders would be equal in height and width. The reaction highs in the middle of the pattern can be connected to form resistance, or a neckline.
- Prior Trend: It is important to establish the existence of a prior downtrend for this to be a reversal pattern. Without a prior downtrend to reverse, there cannot be a Head and Shoulders Bottom formation.
- Left Shoulder: While in a downtrend, the left shoulder forms a trough that marks a new reaction low in the current trend. After forming this trough, an advance ensues to complete the formation of the left shoulder (1). The high of the decline usually remains below any longer trend line, thus keeping the downtrend intact.
- Head: From the high of the left shoulder, a decline begins that exceeds the previous low and forms the low point of the head. After making a bottom, the high of the subsequent advance forms the second point of the neckline (2). The high of the advance sometimes breaks a downtrend line, which calls into question the robustness of the downtrend.
- Right Shoulder: The decline from the high of the head (neckline) begins to form the right shoulder. This low is always higher than the head, and it is usually in line with the low of the left shoulder. While symmetry is preferred, sometimes the shoulders can be out of whack, and the right shoulder will be higher, lower, wider, or narrower. When the advance from the low of the right shoulder breaks the neckline, the Head and Shoulders Bottom reversal is complete.
- Neckline: The neckline forms by connecting reaction highs 1 and 2. Reaction High 1 marks the end of the left shoulder and the beginning of the head. Reaction High 2 marks the end of the head and the beginning of the right shoulder. Depending on the relationship between the two reaction highs, the neckline can slope up, slope down, or be horizontal. The slope of the neckline will affect the pattern's degree of bullishness: an upward slope is more bullish than a downward slope.
- Volume: While volume plays an important role in the Head and Shoulders Top, it plays a crucial role in the Head and Shoulders Bottom. Without the proper expansion of volume, the validity of any breakout becomes suspect. Volume can be measured as an indicator (OBV, Chaikin Money Flow) or simply by analyzing the absolute levels associated with each peak and trough.
- Volume levels during the first half of the pattern are less important than in the second half. Volume on the decline of the left shoulder is usually pretty heavy and selling pressure quite intense. The intensity of selling can even continue during the decline that forms the low of the head. After this low, subsequent volume patterns should be watched carefully to look for expansion during the advances.
- The advance from the low of the head should show an increase in volume and/or better indicator readings, e.g., CMF > 0 or rise in OBV. After the reaction high forms the second neckline point, the right shoulder's decline should be accompanied with light volume. It is normal to experience profit-taking after an advance. Volume analysis helps distinguish between normal profit-taking and heavy selling pressure. With light volume on the pullback, indicators like CMF and OBV should remain strong. The most important moment for volume occurs on the advance from the low of the right shoulder. For a breakout to be considered valid, there needs to be an expansion of volume on the advance and during the breakout.
- Neckline Break: The Head and Shoulders Bottom pattern is not complete, and the downtrend is not reversed until neckline resistance is broken. For a Head and Shoulders Bottom, this must occur in a convincing manner, with an expansion of volume.
- Resistance Turned Support: Once resistance is broken, it is common for this same resistance level to turn into support. Often, the price will return to the resistance break, and offer a second chance to buy.
- Price Target: After breaking neckline resistance, the projected advance is found by measuring the distance from the neckline to the bottom of the head. This distance is then added to the neckline to reach a price target. Any price target should serve as a rough guide, and other factors should be considered, as well. These factors might include previous resistance levels, Fibonacci retracements or long-term moving averages.


 & AMD Framework")
")