

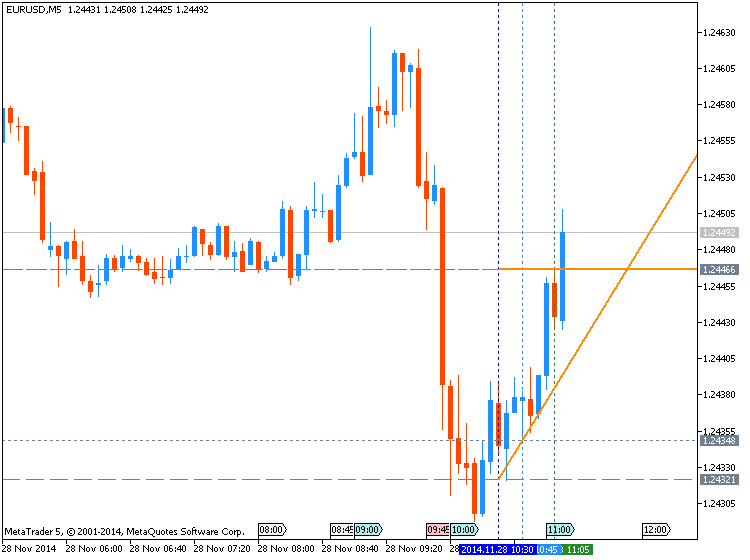
The ascending triangle is formed when the market makes higher lows and the same level highs. These patterns are normally seen in an uptrend and viewed as a continuation pattern as the bulls gain more and more control running up to the top resistance line of the pattern. While you normally will see this pattern form in an uptrend if you do see it in a downtrend it should be paid attention to as it can act as a powerful reversal signal.
Ascending Triangle Example:
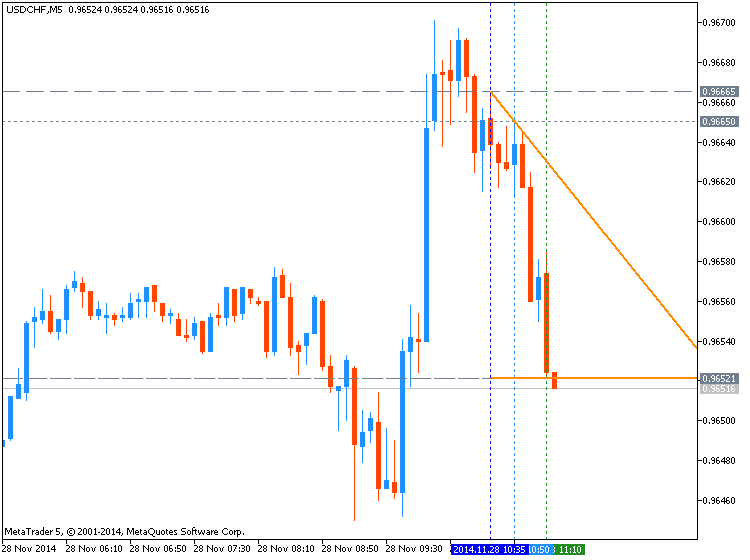
The Descending Triangle:
The descending triangle is formed when the market makes lower highs and
the same level lows. These patterns are normally seen in a downtrend
and viewed as a continuation pattern as the bears gain more and more
control running down to the bottom support line of the pattern. While
you normally will see this pattern form in a downtrend, if you do see it
in an uptrend it should be paid attention to as it can act as a
powerful reversal signal.
Descending Triangle Example:
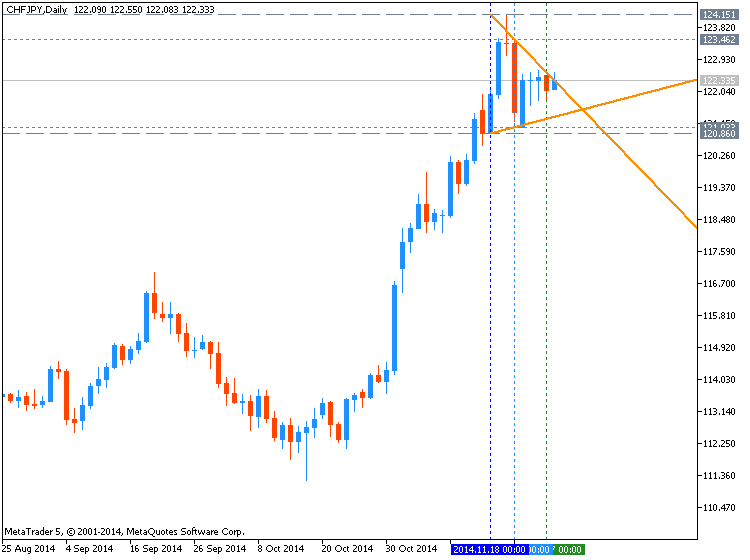
The Symmetrical Triangle:
The symmetrical triangle is formed when the market makes lower highs and
higher lows and is commonly associated with directionless markets as
the contraction of the market range indicates that neither the bulls nor
the bears are in control. If this pattern forms in an uptrend then it
is considered a continuation pattern if the market breaks out to the
upside and a reversal pattern if the market breaks to the downside.
Similarly if the pattern forms in a downtrend it is considered a
continuation pattern if the market breaks out to the downside and a
reversal pattern if the market breaks to the upside.
Symmetrical Triangle Example:


")
