
Price Pattern Analysis for US Dollar, S&P 500 , Gold and Grude Oil - Crude Oil Rebound Stumbles, Gold Prices Treading Water

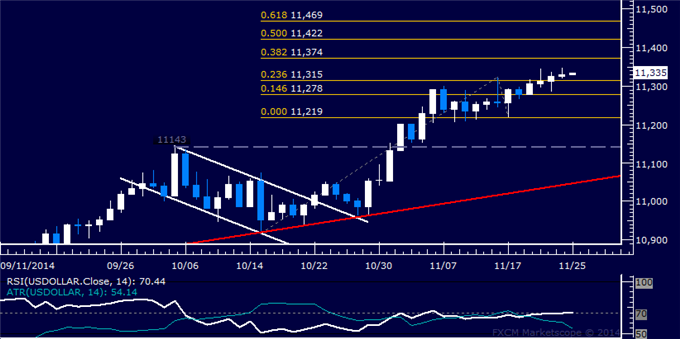
US DOLLAR TECHNICAL ANALYSIS
Prices edged higher for a fourth
consecutive day, with buyers seemingly on pace to set a new year-to-date
high. Near-term resistance is at 11374, the 38.2% Fibonacci expansion,
with a break above that on a daily closing basis exposing the 50% level
at 11422.
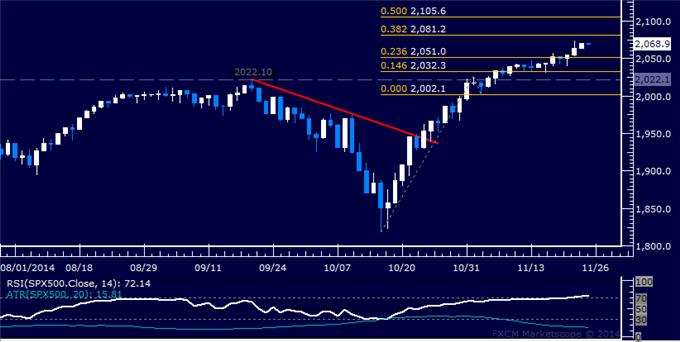
S&P 500 TECHNICAL ANALYSIS
Prices continue to march higher
after clearing resistance at 2051.00, the 23.6% Fibonacci expansion,
with buyers aiming to challenge the 38.2% level at 2081.20. A further
push beyond that targets the 50% Fib at 2105.60.
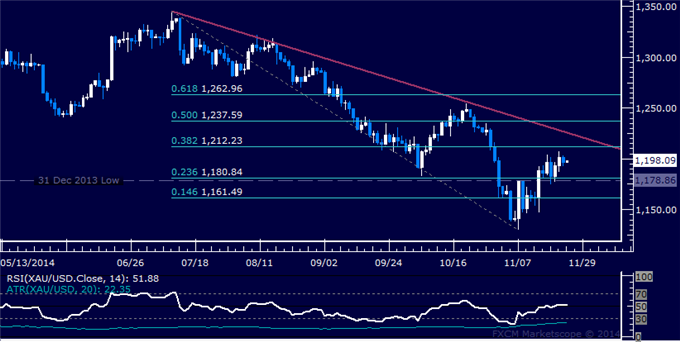
GOLD TECHNICAL ANALYSIS
Prices are edging upward en route
toward resistance at 1212.23, the 38.2% Fibonacci retracement. A daily
close above this barrier exposes a falling trend line at 1226.78.
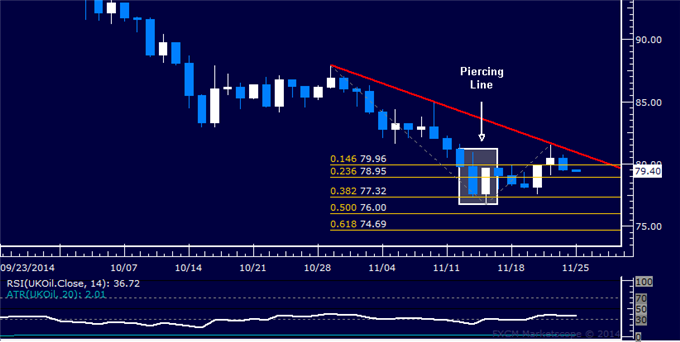
CRUDE OIL TECHNICAL ANALYSIS
Prices stumbled after trying to
bounce as expected following the formation of a bullish Piercing Line
candlestick pattern. A daily close below the 23.6% Fibonacci expansion
at 78.95 exposes the 38.2% level at 77.32.


")