- US Dollar on the Verge of Major Breakdown Again
- S&P 500 Digesting After Recoiling from Resistance
- Gold, Crude Oil Locked in Familiar Trading Ranges
US DOLLAR TECHNICAL ANALYSIS – Prices remain under pressure as prices
test below multi-year rising trend support set from July 2011. A daily
close below this barrier (now at 10421) exposes a falling channel bottom
at 10398, followed by double bottom support at 10375.Channel top
resistance is at 10457, with a move above that exposing the 10474-95
cluster. The next topside barrier after that stands at 10531, May 28
high.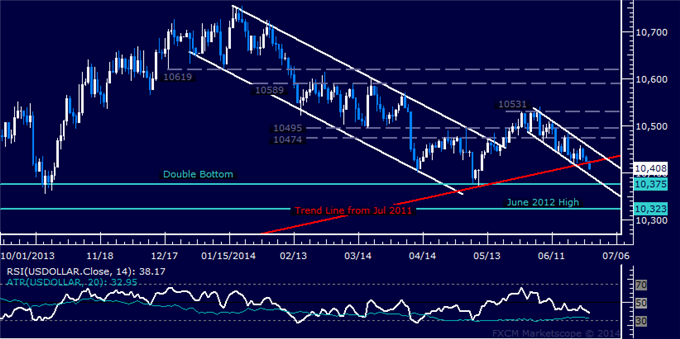
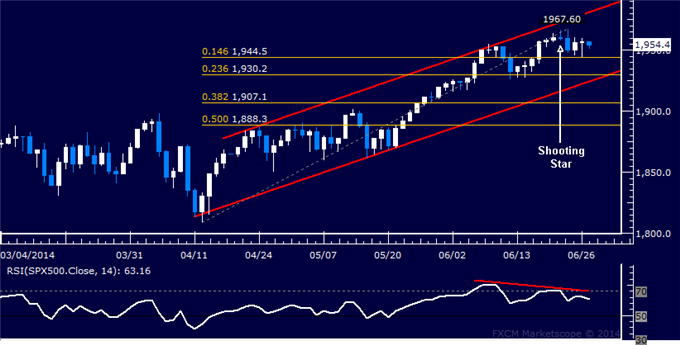
S&P 500 TECHNICAL ANALYSIS – Prices turned lower as expected after putting in a Shooting Star candlestick coupled with negative RSI divergence. Sellers are testing the 14.6% Fibonacci retracement at 1944.50, with a break below that on a daily closing basis exposing the 23.6% level at 1930.20. Alternatively, a reversal above the June 24 high at 1967.60 aims for a rising channel top at 1981.10.
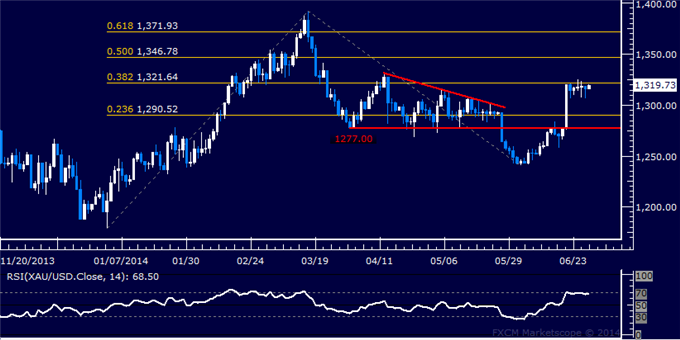
GOLD TECHNICAL ANALYSIS – Prices are treading water after launching sharply higher last week to challenge resistance at 1321.64, the 38.2% Fibonacci expansion. A break above this barrier targets the 50% level at 1346.78. Alternatively, a turn back below the 1300/oz figure aims for the 1277.00-90 area, marked by April 1 low and the 23.6% Fib.
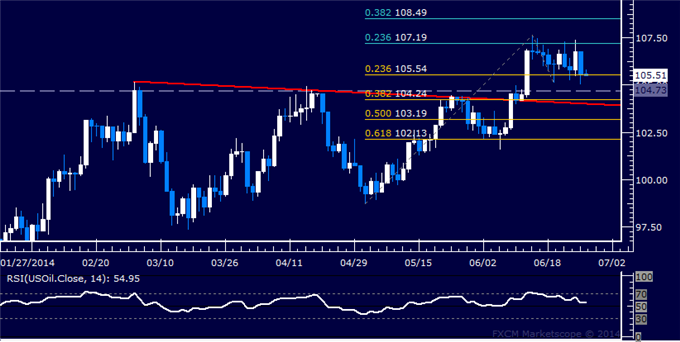
CRUDE OIL TECHNICAL ANALYSIS – Prices remain in consolidation mode below resistance at 107.19, the 23.6% Fibonacci expansion.A daily close above this barrier initially targets the 38.2% level at 108.49. Alternatively, a reversal below the 23.6% Fib retracementat 105.54 clears the way for a test of the 104.24-73 area, marked by a formerly broken triple top and the 38.2% threshold.
