

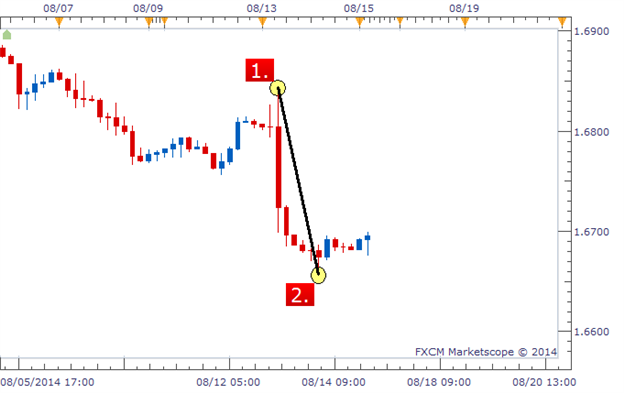
Where exactly is that? For starters, we need to identify an extended move up or down on our chart. In other words, a swing low followed by a defined high or a swing high followed by a defined low. Below, we have an example of a swing high (labeled 1) followed by a swing low (labeled 2).
Drawing Fibonacci Retracement on a Chart
What Do the Fibonacci Lines Mean?
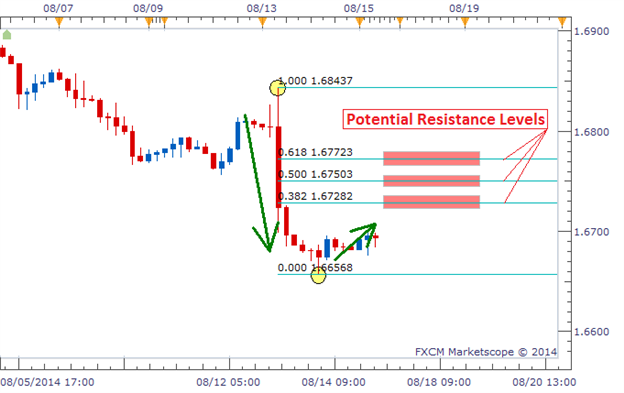
After drawing the two data points, we see 3 blue lines appear between
the high and the low: 0.382, 0.500, and 0.618. These numbers represent
how far price could retrace in percentage terms. So if price rose back
to the 0.382 level, that would be a retracement of 38.2% of the original
move. If price rose to the 0.500 level, that would be a retracement of
50% of the original move. If price rose to the 0.618 level, that would
be a retracement of 61.8% of the original move.
We can see these levels labeled in the chart below as potential
resistance levels. These are price levels that price could bounce off
of.
Fibonacci Retracement Projecting Potential Resistance Levels
There is no exact science to determine which level price will bounce or
if price will bounce off any of the levels at all. But time and time
again, we will see price bounce off of one of these three retracement
levels created by using Fibonacci.
Why Does Fibonacci Seem to Work?
This is probably the most popular question I get regarding Fibonacci.
Why does price bounce off these levels? What is the ‘magic’ that causes
this? In my opinion, there is no magic involved in it at all. What
causes price to sometimes react around these levels is due to the fact
that many people are watching these exact same levels.
If we have a large number of traders all looking at the same levels for a
turnaround in price, they could create a cluster of orders that causes
price to actually turn around at that level. It won’t always be that cut
and dry, but that is the gist of using this type of tool. We are
expecting other traders to be looking at these levels and cause price to
react at these levels. It is self-fulfilling,
Price Bouncing Off Fibonacci’s 38.2% Retracement Level
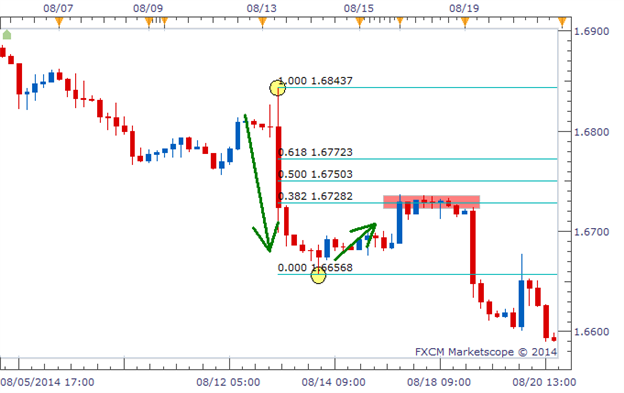
The chart above shows the outcome of our example. Price retraced up to
the 38.2% retracement level and stalled for a while before moving back
in the direction of the original move. Traders that traded the potential
bounce off of this level had a very successful trade without having to
take on a lot of risk if they used a tight stop.


")