
EUR/GBP Technical Signals – Negative Reversal vs. Extended Bullish Divergence
EUR/GBP has been on bearish in 2014 since the high on the year at 0.84.
Price has been trading within a falling channel.
The RSI has tagged 30, and has held below 60, even below 50. This reflects maintenance of bearish momentum.
The moving averages are in bearish alignment, with the 200-day above the 100-day, which is above the 50-day. The MAs are all sloping down and are spreading apart. Based on the moving averages, there are NO signs of a let up in the bearish trend.

Negative Reversal:
Let’s get into the RSI again. Last week, when price made a high at
0.7980, it was lower than the the 0.8033 high. However, the RSI high
after coming up from oversold conditions, was higher. Based on RSI guru,
Andrew Cardwell’s observations, this is call a negative reversal
signal, which suggests another bearish swing. We got that additional
bearish swing last week, and we are now faced with an extended bullish
divergence.
Extended Bullish Divergence:
Looking at the daily chart again, we can see that the RSI lows are
higher, as price makes lower lows. While the negative reversal set up
points to further decline, the build up of the extended bullish
divergence suggests pending consolidation/bullish correction.
Simple Observation: It won’t be difficult to judge a shift away from the persistently bearish trend EUR/GBP has been in since March.
1) If price breaks above 0.7980 it will be breaking the pattern of lower highs and lower lows.
2) If price breaks above the falling channel resistance, which should
happen if price breaks above the 0.7980 high, then the bearish pattern
is broken, and the market is more likely in consolidation.
38.2% Retracement:
Although I am still bearish on the EUR/GBP, I would air on caution and
wait for a consolidation larger than the brief ones we have seen within
the falling channel. In fact I would monitor the 0.8033 level up to the
0.8084 level for sellers. The 0.8033 level is a previous resistance and
where the 50-day SMA resides. The 0.8084 level is 38.2% retracement and
near a previous support pivot. If the RSI reading approaches 60, holds,
and turns back down, I would also be ready for another bearish
continuation swing to test the 0.7888 low on the year so far.
If the market does continue the bearish trend, with or without a significant correction, the next key support will be the 2012-low around 0.7765.
The weekly chart shows that there is no established trend in the past
4-years, so if price pushes away from the mean price action reflected by
the moving averages, the more likely it will revert back. The weekly
RSI being at 30 therefore would suggest some bullish correction at least
in the short-term.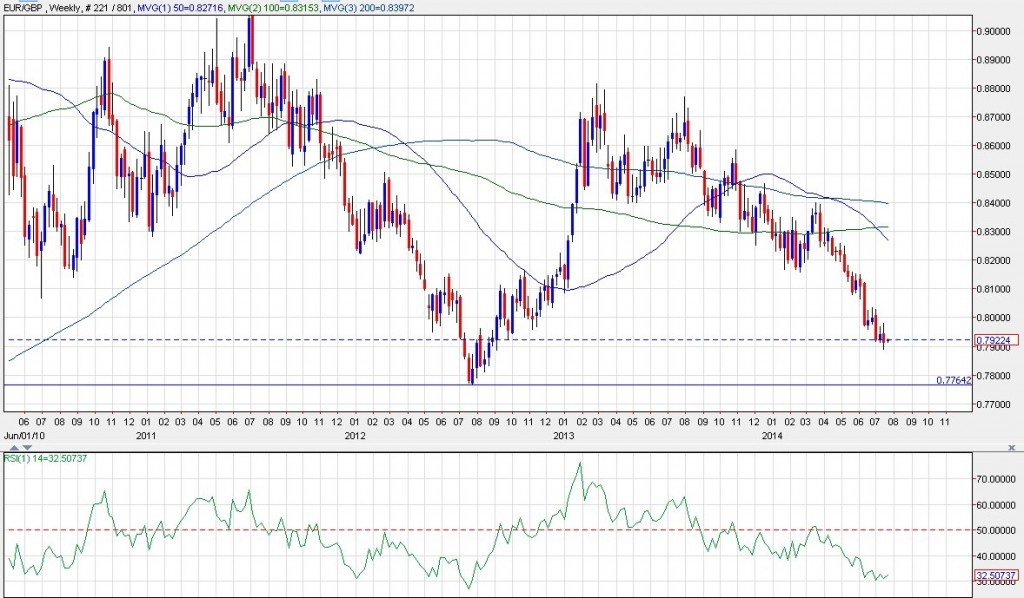


 Trading Guide")

