
Multiple Regression Analysis. Strategy Generator and Tester in One
Introduction
An acquaintance of mine when attending a Forex trading course, once received an assignment to develop a trading system. After having trouble with it for about a week, he said, that this task was probably more difficult than writing a thesis. It was then that I suggested using the multiple regression analysis. As a result, a trading system developed from scratch overnight was successfully approved by the examiner.
The success of using the multiple regression is in the ability to quickly find relationships between indicators and price. The relationships detected allow to predict the price value based on the indicator values with a certain degree of probability. Modern statistical software allows to simultaneously filter thousands of parameters in trying to find these relationships. This can be compared to industrial sifting gold from gravel.
A ready to use strategy as well as a strategy generator will be developed by loading the indicator data into the multiple regression analysis and applying data manipulation, respectively.
This article will demonstrate the process of creating a trading strategy using the multiple regression analysis.
1. Developing a Robotrader - Piece of Cake!
The backbone of the trading system developed overnight as mentioned earlier was one sole equation:
Reg=22.7+205.2(buf_DeMarker[1]-buf_DeMarker[2])-14619.5*buf_BearsPower[1]+22468.8*buf_BullsPower[1]-139.3*buf_DeMarker[1]-41686*(buf_AC[1]-buf_AC[2])
where if Reg >0, then we buy, and if Reg < 0, we sell.
The equation was an outcome of the multiple regression analysis that used the data sample from standard indicators. An EA was developed on the basis of the equation. The piece of code in charge of trading decisions virtually consisted of 15 lines only. The EA with a complete source code is attached (R_check).
   //--- checking the price change range
   double price=(mrate[2].close-mrate[1].close)/_Point;


   //--- if the range is big, do not take trades and close the current positions
   if(price>250 || price<-250)
     {
      ClosePosition();
      return;

     }

   //--- regression equation
   double Reg=22.7+205.2*(buf_DeMarker[1]-buf_DeMarker[2])

                 -14619.5*buf_BearsPower[1]+22468.8*buf_BullsPower[1]
                 -139.3*buf_DeMarker[1]
                 -41686*(buf_AC[1]-buf_AC[2]);


   //--- checking for open positions
   if(myposition.Select(_Symbol)==true) //--- open positions found
     {
      if(myposition.PositionType()==POSITION_TYPE_BUY)

        {
         Buy_opened=true;  // long position (Buy)
        }
      if(myposition.PositionType()==POSITION_TYPE_SELL)
        {
         Sell_opened=true; //--- short position (Sell)

        }
     }

   //--- if an open position follows the trend as predicted by the equation, abstain from doing anything.
   if(Reg>0  &&  Buy_opened==true) return;
   if(Reg<=0 && Sell_opened==true) return;


   //--- if an open position is against the trend as predicted, close the position.
   if(Reg<=0 && Buy_opened==true) ClosePosition();
   if(Reg>0 && Sell_opened==true) ClosePosition();


   //--- opening a position in the direction predicted by the equation.
   //--- using level 20 to filter the signal.
   if(Reg>20) BuyOrder(1);
   if(Reg<-20) SellOrder(1);
The data sample for the regression analysis was collected on EURUSD H1 over two months from July 1, 2011 to August 31, 2011.
Fig. 1 shows the EA performance results over the data period for which it was developed. It is peculiar that superprofit, which is often the case in the Tester, was not observed on the training data. It must be a sign of lack of reoptimization.

Fig. 1. EA performance over the training period
Fig. 2 demonstrates the EA performance results on the test data (from September 1 to November 1, 2011). It appears that the two-month data was sufficient for the EA to remain profitable for another two months. That said, the profit made by the EA over the testing period was the same as over the training period.

Fig. 2. EA performance over the testing period
Thus, based on the multiple regression analysis a fairly simple EA was developed yielding profit beyond the training data. The regression analysis can therefore be successfully applied when building trading systems.
However, resources of the regression analysis should not be overestimated. Its advantages and disadvantages will be set forth further below.
2. Multiple Regression Analysis
The general purpose of the multiple regression is the analysis of the relationship between several independent variables and one dependent variable. In our case, it is the analysis of the relationship between values of indicators and the price movement.
In its simplest form, this equation may appear as follows:
Price change = a * RSI + b * MACD + с
A regression equation can only be generated if there is a correlation between independent variables and a dependent variable. Since values of indicators are as a rule interrelated, the contribution made by indicators to the forecast may appreciably vary if an indicator is added or removed from the analysis. Please note that a regression equation is a mere demonstration of the numerical dependence and not a description of causal relationships. Coefficients (a, b) indicate the contribution made by every independent variable to its relationship with a dependent variable.
A regression equation represents an ideal dependence between the variables. This is however impossible in Forex and the forecast will always differ from the reality. Difference between the predicted and observed value is called the residual. Analysis of residuals allows to identify inter alia a nonlinear dependence between the indicator and price. In our case, we assume that there is only nonlinear dependence between indicators and price. Fortunately, the regression analysis is not affected by minor deviations from linearity.
It can only be used to analyze quantitative parameters. Qualitative parameters that do not have transitional values are not suitable for the analysis.
The fact that the regression analysis can process any number of parameters may lead to the temptation to include into analysis as many of them as possible. But if the number of independent parameters is bigger than the number of observations of their interaction with a dependent parameter, there is a great chance of getting equations producing good forecasts which are however based on random fluctuations.
The number of observations shall be 10-20 times bigger than the number of independent parameters.
In our case, the number of indicators contained in the data sample shall be 10-20 times bigger than the number of trades in our sample. The equation generated will then be considered reliable. The sample based on which the Robotrader as described in section 1 was developed, contained 33 parameters and 836 observations. As a result, the number of parameters was 25 times bigger than the number of observations. This requirement is a general rule in statistics. It is also applicable to the MetaTrader 5 Strategy Tester optimizer.
Furthermore, every given value of the indicator in the optimizer is in fact a separate parameter. In other words, when testing 10 indicator values, we are dealing with 10 independent parameters which shall be taken into consideration in order to avoid reoptimization. A report of the optimizer should probably include another parameter: average number of trades/number of values of all optimized parameters. If the indicator value is less than ten, chances are that reoptimization will be required.
Another thing to be considered is outliers. Rare yet powerful events (in our case price spikes) may add false dependencies to the equation. For example, following the unexpected news, the market responded with substantial movements lasting for a few hours. The values of technical indicators would in this case be of little importance in the forecast yet they would be considered highly significant in the regression analysis as there was a marked price change. It is therefore advisable to filter the sample data or check it for possible outliers.
3. Creating Your Own Strategy
We have approached the key part where we will see how to generate a regression equation based on your own data. Implementation of the regression analysis is similar to that of the discriminant analysis set forth earlier on. Regression analysis includes:
- Preparation of data for the analysis;
- Selection of the best variables from the prepared data;
- Obtaining a regression equation.
Multiple regression analysis is a part of numerous advanced software products intended for statistical data analysis. The most popular are Statistica (by StatSoft Inc.) and SPSS (by IBM Corporation). We will further consider the application of the regression analysis using Statistica 8.0.
3.1. Preparation of Data for the Analysis
We are to generate a regression equation where the price behavior on the next bar can be predicted based on the indicator values on the current bar.
The same EA that was used for the discriminant analysis data preparation will be used for collecting data. We will expand its functionality by adding a function for saving indicator values with other periods. An extended set of parameters will be used for strategy optimization based on the analysis of the same indicators but with different periods.
To load data in Statistica, you should have a CSV file with a following structure. Variables shall be arranged in columns where every column corresponds to a certain indicator. The rows shall contain consecutive measurements (cases), i.e. values of indicators for certain bars. In other words, the horizontal table headers contain indicators, the vertical table headers contain consecutive bars.
Indicators to be analyzed are:
- Accelerator Oscillator;
- Bears Power;
- Bulls Power;
- Awesome Oscillator;
- Commodity Channel Index;
- DeMarker;
- Fractal Adaptive Moving Average;
- MACD;
- Relative Strength Index;
- Money Flow Index;
- Stochastic;
- Williams Percent Range.
Every data row of our file will contain:
- Changes in price on the bar between Open and Close;
- Values of indicators observed on the preceding bar.
Thus, we will generate an equation describing the future price behavior based on the known indicator values.
Apart from the absolute indicator value, we need to save the difference between the absolute and the preceding values in order to see the direction of the change in indicators. The names of such variables in the example provided will have prefix 'd'. For signal line indicators, it is necessary to save the difference between the main and signal line as well as its dynamics. The names of the data collected by indicators with other periods end with '_p'.
In order to demonstrate the optimization, only one period was added, being twice the length of the standard period of the indicator. In addition, save the time of the new bar and the relevant hour value. Save the difference between Open and Close for the bar where the indicators are calculated. This will be required to filter outliers. As a result, 33 parameters will be analyzed to generate a multiple regression equation. The above data collection is implemented in the EA R_collection attached to the article.
The MasterData.CSV file will be created after starting the EA in terminal_data_directory/MQL5/Files. When starting the EA in the Tester, it will be located in terminal_data_directory/tester/Agent-127.0.0.1-3000/MQL5/Files. The file as obtained can be used in Statistica.
An example of such file can be found in MasterDataR.CSV. The data was collected for EURUSD H1 from January 3, 2011 to November 11, 2011 using the Strategy Tester. Only the August and September data was used in the analysis. The remaining data was saved in a file for you to practice.
In order to open the .CSV file in Statistica, do as follows.
- In Statistica, go to menu File > Open, select the file type 'Data files' and open your .CSV file.
- Leave Delimited in the Text File Import Type window and click OK.
- Enable the underlined items in the opened window.
- Bear in mind to put the decimal point in the Decimal separator character field regardless of whether it is already there or not.
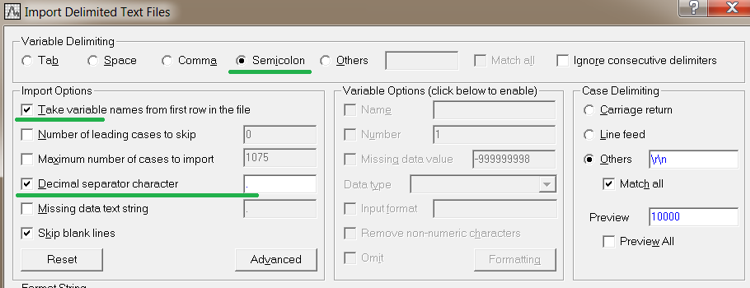
Fig. 3. Importing the file into Statistica
Click OK to get the table containing our data which is ready for the multiple regression analysis. An example of the obtained file to be used Statistica can be found in MasterDataR.STA.
3.2. Automatic Selection of Indicators
Run the regression analysis (Statistics->Multiple Regression).
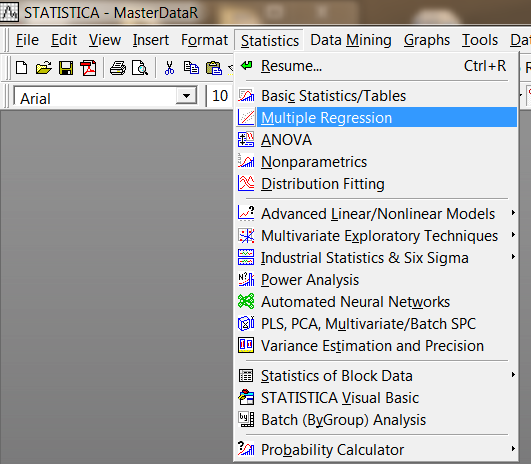
Fig. 4. Running the regression analysis
In the opened window, go to the Advanced tab and enable the marked items. Click the Variables button.
Select the Dependent variable in the first field and Independent variables based on which the equation will be generated - in the second field. In our case, select the Price parameter in the first field and Price 2 to dWPR - in the second field.
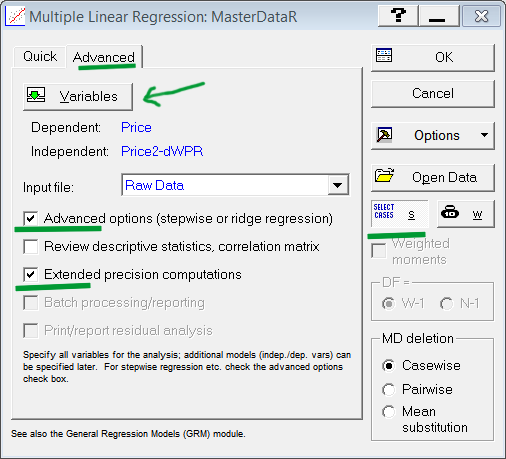
Fig. 5. Preparation to selection of parameters
Click the Select Cases button (Fig. 5).
A window will open for selection of cases (data rows) which will be used in the analysis. Enable items as shown in Fig. 6.
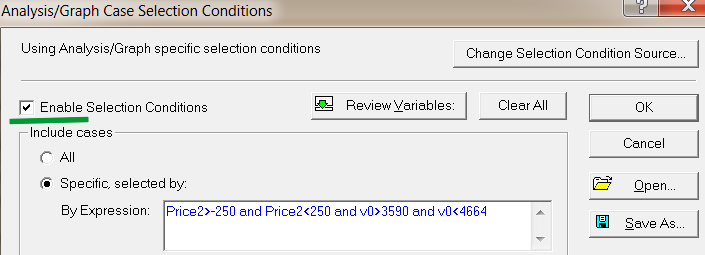
Fig. 6. Selection of cases
Specify the data pertaining to July and August that will be used in the analysis. These are cases from 3590 to 4664. The numbers of cases are set via the variable V0. In order to avoid the effect of outliers and price spikes, add data filtering by price.
Include in the analysis only those indicator values for which the difference between Open and Close on the last bar is not more than 250 points. By specifying here the rules for selecting cases for the analysis, we have set a data sample for regression equation generation. Click OK here and in the window for preparation to selection of parameters (Fig. 5).
A window with options of the automatic data selection methods will open. Select the Forward Stepwise method (Fig. 7).
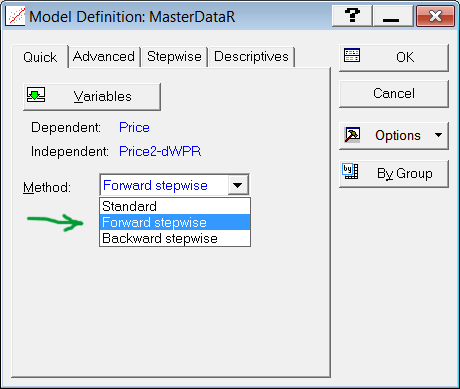
Fig. 7. Method selection
Click OK. And a window will open informing you that the regression analysis was successfully completed.
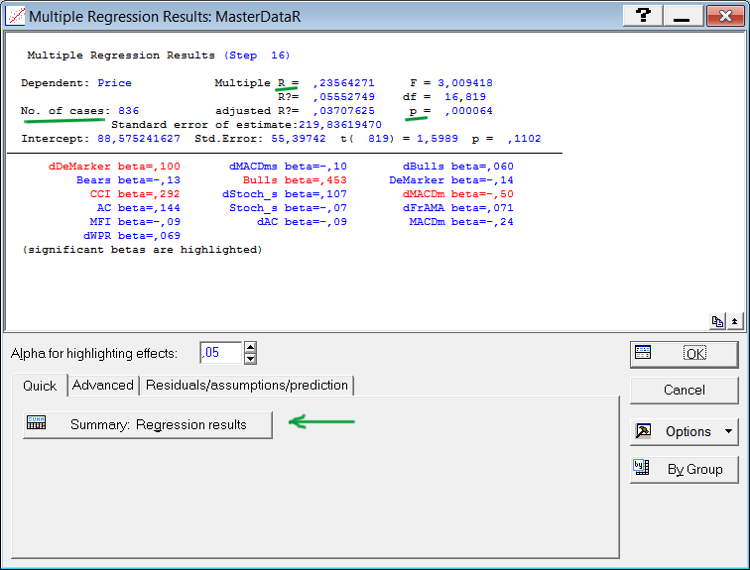
Fig. 8. Window of results of the regression analysis
Automatic selection of parameters concerns only those that contribute materially to the multiple correlation between the parameters (independent variables) and the dependent variable. In our case, a set of indicators will be selected, best determining price. In effect, the automatic selection acts as a strategy generator. The generated equation will only consist of the indicators that are reliable and best describe the price behavior.
The upper part of the window of results (Fig. 8) contains statistical characteristics of the generated equation while the parameters included in the equation are listed at the bottom. Please pay attention to the underlined characteristics. Multiple R is the value of multiple correlation between the price and indicators included in the equation. "p" is the level of statistical significance of such correlation.
A level of less than 0.05 is considered statistically significant. "No. of cases" is the number of cases used in the analysis. The indicators whose contribution is statistically significant are displayed in red. Ideally, all indicators shall be marked in red.
The rules used in Statistica for including parameters in the analysis are not always optimal. For example, a great number of insignificant parameters may get included in a regression equation. We should therefore use our creativity and assist the program in selecting parameters.
If the list contains insignificant parameters, click Summary: Regression results.
A window will open displaying the data on every indicator (Fig. 9).
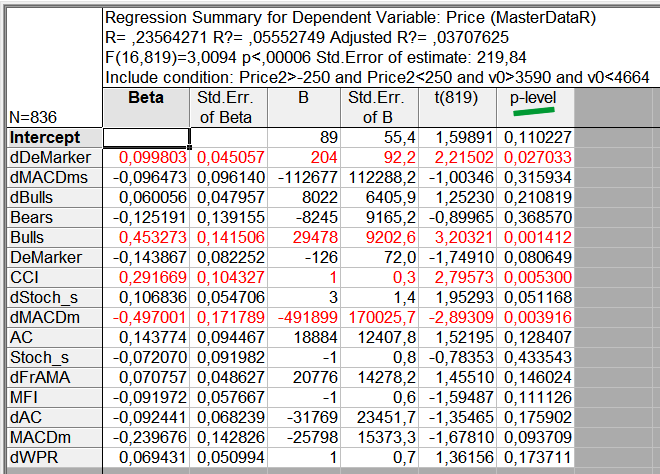
Fig. 9. Report on the parameters included in the regression equation
Find an insignificant parameter with the highest p-level and remember its name. Go back to the step where the parameters were being included in the analysis (Fig. 7) and remove this parameter from the list of the parameters selected for the analysis.
To return, click Cancel in the window of the analysis results and repeat the analysis. Try to exclude all insignificant parameters in this manner. In so doing, look out for the obtained multiple correlation value (Multiple R) as it should not be considerably lower than the initial value. Insignificant parameters can be removed from the analysis one by one or all at once, the first option being more advisable.
As a result, the table now only contains the significant parameters (Fig. 10). The correlation value has decreased by 20% which is probably due to random coincidences. An infinitely long numerical series is known to have an infinite number of random coincidences.
Since data samples we process are quite large, random coincidences and random relationships are often the case. It is therefore important to use statistically significant parameters in your strategies.
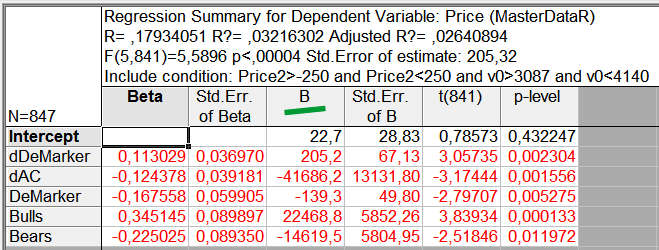
Fig. 10. The equation includes the significant parameters only
If following the selection of the parameters, a group of several indicators significantly correlating with the price cannot be formed, the price is likely to contain little information on the past events. Trades based on any technical analysis should in cases like this be very prudent or even suspended altogether.
In our case, only five out of 33 parameters have proven to be effective in developing a strategy on the basis of the regression equation. This quality of the regression analysis is of great benefit when selecting indicators for your own strategies.
3.3. Regression Equation and its Analysis
So we ran the regression analysis and obtained the list of the 'right' indicators. Let us now transform it all into a regression equation. The equation coefficients for every indicator are shown in column B of the regression analysis results (Fig. 10). The Intercept parameter in the same table is an independent member of the equation and is included in it as an independent coefficient.
Let us generate an equation based on the table (Fig. 10), taking coefficients from column B.
Price = 22.7 + 205.2*dDemarker - 41686.2*dAC - 139.3*DeMarker + 22468.8*Bulls - 14619.5*Bears
This equation was set forth earlier in section 1 as an MQL5 code along with the performance results obtained from the Tester for the EA developed on the basis of this equation. As can be seen, the regression analysis was adequate when used as a strategy tester. The analysis brought forward a certain strategy and selected relevant indicators from the proposed list.
In case you wish to further analyze the stability of the equation, you should check for:
- Outliers in the equation;
- Normality of distribution of the residuals;
- Nonlinear effect produced by individual parameters within the equation.
These checks can be carried out using the residual analysis. To proceed to the analysis, click OK in the window of results (Fig. 8). After carrying out the above checks with regard to the generated equation, you will see that the equation does not appear to be sensitive to a small number of outliers, small deviation from the normal distribution of data and a certain nonlinearity of the parameters.
If there is a significant nonlinearity of relationship, a parameter can be linearized. For this purpose, Statistica offers a fixed nonlinear regression analysis. To start the analysis, go to the menu: Statistics -> Advanced Linear/Nonlinear Models -> Fixed Nonlinear Regression. In general, the performed checks have proven that the multiple regression analysis is not sensitive to a moderate amount of noise in the analyzed data.
4. Regression Analysis as a Strategy Optimizer
Since the regression analysis is capable of processing thousands of parameters, it can be used to optimize strategies. Thus, if 50 periods for an indicator need to be processed, they can be saved as 50 individual parameters and sent to the regression analysis, all at once. A table in Statistica can fit 65536 parameters. When processing 50 periods for every indicator, around 1300 indicators can be analyzed! It is far beyond the capabilities of the MetaTrader 5 Standard Tester.
Let us optimize the data used in our example in the same way. As mentioned in section 4.1 above, in order to demonstrate the optimization, the indicator values with a period being twice the length of the standard one were added to the data. The names of these parameters in the data files end with '_p'. Our sample now contains 60 parameters including the standard period indicators. Following the steps as set forth in section 3.2, we will get a table as follows (Fig. 11).
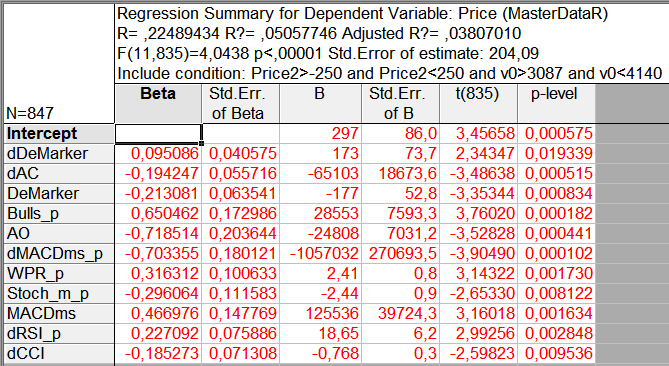
Fig. 11. Results of the analysis of the indicators with different periods
The regression equation has comprised 11 parameters: six from the standard period indicators and five from the extended period indicators. The correlation of the parameters with the price increased by a quarter. Parameters of the MACD indicator for both periods appeared to be included in the equation.
Since values of the same indicator for different periods are treated as different parameters in the regression analysis, the equation may comprise and combine values of the indicators for different periods. E.g. the analysis may discover that the RSI(7) value is associated with the price increase and RSI(14) value is associated with the price decrease. The analysis by the Standard Tester is never so detailed.
The regression equation generated on the basis of the extended analysis (Fig. 11), is as follows:
Price = 297 + 173*dDemarker - 65103*dAC - 177*DeMarker + 28553*Bulls_p - 24808*AO - 1057032*dMACDms_p + 2.41*WPR_p - 2.44*Stoch_m_p + 125536*MACDms + 18.65*dRSI_p - 0.768*dCCI
Let us see the results this equation will yield in the EA. Fig. 12 shows the results of testing the EA using the data from July 1 to September 1, 2011 that was applied in the regression analysis. The chart has got smoother and the EA has yielded more profit.

Fig. 12. EA performance over the training period
Let us test the EA over the testing period from September 1 to November 1, 2011. The profit chart has become worse than it was in case with the EA with standard period indicators only. The equation as generated might need to be checked for normality and nonlinearity of internal indicators.
Since nonlinearity was observed in standard period indicators, it could become critical over the extended period. In this case, the equation performance can be improved by linearizing the parameters. Either way, the EA was not a total meltdown over the testing period, it simply did not profit. This qualifies the developed strategy as quite stable.

Fig. 13. EA performance over the testing period
It should be noted that MQL5 supports the output of only 64 parameters in one line of a file. A large-scale analysis of indicators over various periods will require merging the data tables which can be done in Statistica or MS Excel.
Conclusion
A small study presented in the article has shown that the regression analysis provides an opportunity to select from a variety of indicators the most significant ones in terms of price prediction. It has also demonstrated that the regression analysis can be used to search for indicator periods that are optimal within a given sample.
It should be noted that regression equations are easily transformed into MQL5 language and their application does not require high proficiency in programming. Thus, the multiple regression analysis can be employed in trading strategy development. That said, a regression equation can serve as a backbone for a trading strategy.
Translated from Russian by MetaQuotes Ltd.
Original article: https://www.mql5.com/ru/articles/349
Warning: All rights to these materials are reserved by MetaQuotes Ltd. Copying or reprinting of these materials in whole or in part is prohibited.
This article was written by a user of the site and reflects their personal views. MetaQuotes Ltd is not responsible for the accuracy of the information presented, nor for any consequences resulting from the use of the solutions, strategies or recommendations described.
 Simple Trading Systems Using Semaphore Indicators
 Time Series Forecasting Using Exponential Smoothing (continued)
 The Box-Cox Transformation
 Trademinator 3: Rise of the Trading Machines
- Free trading apps
- Over 8,000 signals for copying
- Economic news for exploring financial markets
You agree to website policy and terms of use
very similar to neural networks
SZY: and even if it is not NS, the result of such a tool will be similar to the work of NS - on the history of positive results
very similar to neural networks
SZY: and even if it will be not NS, the result of such a tool will be similar to the work of NS - on the history of positive results
Yes, exactly. That's why such methods are not enough. (but necessary!)
;-)
Integer:.
What are the factors? All indicators with all possible sets of parameters from all possible symbols?
We don't need all of them. We need only promising ones. And therefore the decisive factor is the ability to find these "promising ones".
And the task of the method is to destroy hopes, i.e. to recognise "false promising".
Which, strictly speaking, is also valuable.
// "Kill hope in time!" (ts) me
Dear Sir,
I know nothing about how to use this or the other items that you have written about. I have tried to write the discriminate EA but cannot get the EA to allow me to load the wizard without loading the indicators via the wizard. Doing it this way makes the "int OnInit()" section look different than the one in your article. Do I need to erase all of the info from that section and make my sections look like yours? Where is the Statistica program on MQL 5? How do I open it? Maybe it would be better for me to ask you if you would help me with what I am trying to do or if you know someone that can? I will share the wealth on the idea, but do not want it pubplished nor marketed. Currently, the plan works 85% of the time, but could be better. Likewise, once it is optimized, trading it would be easier through a custom indicator, again I'm lost on how to write one of those as well. Do you know anything about the programming language of TD Ameritrade's Thinkorswim platform? You see, in order to make this work we need access to the currencies underlying indicators, such as DX, 6e, 6a, 6j, and other economic indices. Does TOS have the Statistica program? Please contact me via email dennie3166@yahoo.com
Thank you so very much,
Dennie.
Dear Artem,
Dear traders,
I am really impressed by this article, but unfortunatelythe attached files "r_check.mq5" and "r_collection.mq5" are not working. Actually they don't even appear in my MT5.
Does anyone knows what the rwason could be. I will be really greatful!
Thank you in advance!
Best regards,
Nikolay Hristov