

Encoding Candlestick Pattern (Part 6): Developing the Encoded Sequence Indicator
 329
329
 0
0

Introduction
Until now, the encoded candlestick stream and the frequency tables derived from it have lived offline: exported to .txt files and analyzed separately from the trading chart. That separation creates a practical gap for both active traders and developers — there is no continuous, on‑chart symbolic stream that highlights where unclassified but directionally meaningful candles (N/n) appear, and there is no immediate percent breakdown of candle types over a chosen historical window. This article addresses that gap with a precise, on‑chart solution for MetaTrader 5.
In Part 5 we expanded the candlestick taxonomy by introducing the symbols N and n to represent bullish and bearish unclassified candlesticks, respectively. In earlier parts of the series (Parts 1, 3, and 4), the underscore character (_) served as a generic placeholder for any candlestick that failed to meet the classification criteria for A/a, H/h, E/e, G/g, or D. While functional, the underscore conveyed only that a candle was unclassified and carried no directional information.
Adding N (bullish unclassified) and n (bearish unclassified) removes this limitation. Directional symbols now enable more granular analysis of two-, three-, and four-candlestick patterns. A sequence such as gNn, for example, retains directional information that was previously lost when both candles were reduced to g__. This refined taxonomy adds directional information to the pattern sequences, resulting in more detailed percentage distributions across multi-candlestick structures and providing a richer representation for further analysis. The expanded taxonomy established in Part 5 is used throughout the remainder of this article.
In this article, we render a live encoded symbol stream directly on the trading chart. We develop an MQL5 indicator that implements the encoded-candlestick framework and overlays the statistical outcomes of each symbol across a user-specified number of candlesticks. The on-chart symbols form a visual 'language of the market.' They provide a visual means of identifying unclassified candlesticks (N and n) and examining sequences that may be less apparent on conventional candlestick or bar charts. However, the visual representation alone does not establish that these sequences are statistically significant or tradable.
From Offline Statistical Analysis to Live Chart Analysis
Throughout the series, our primary deliverables have been text-based outputs—encoded series and frequency tables saved as.txt
files for use by external analytical tools. While these outputs are valuable for offline research, backtesting, and statistical modeling, they do not provide live feedback to the active trader.
This article bridges that gap by moving the encoded symbol stream directly onto the trading chart. We develop an MQL5 indicator that:
- Encodes each completed candlestick using the complete taxonomy (A/a, H/h, E/e, G/g, D, N/n) and updates the displayed symbol only when a new bar appears, thereby avoiding repainting.
- Displays the encoded symbol stream as a visual overlay on the price chart, updating discretely when each candlestick closes.
- Provides statistical context for each symbol—specifically, the percentage distribution of each candlestick type over a user-defined lookback period.
This indicator transforms the chart into a "language of the market"—a symbolic representation of completed price action that updates discretely when each bar closes and can be read alongside the traditional candlestick visualization.
The Encoded Series as a Market Language
The visual representation of the encoded sequence introduces a different way of reading price action. Instead of relying exclusively on the traditional appearance of candlesticks, traders can observe the symbolic structure generated from the classification rules.
For example, a sequence such as AAHnN can be interpreted as a sequence of classified bullish, unclassified bearish, and bullish candlestick structures according to the taxonomy established in this series.
The significance of this approach is not necessarily in the individual symbols themselves, but in the relationships and sequences formed by consecutive symbols. A trader may begin to recognize recurring combinations, transitions, or clusters that are difficult to identify when looking only at the graphical shape of conventional candlesticks.
Consequently, the encoded chart can be viewed as a kind of market language, where each candlestick contributes a character, and consecutive candlesticks form words or sequences that can be statistically investigated.
Figure 1 compares the chart before and after applying the indicator. The enhanced chart displays alphabetic symbols representing candle types, revealing the encoded language of the market.
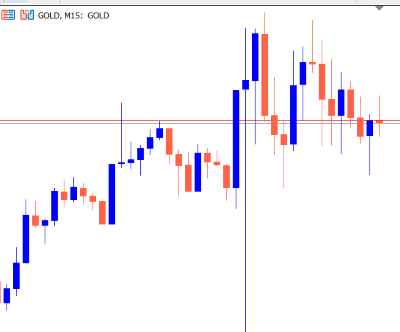 A: Before the indicator is applied to the chart | 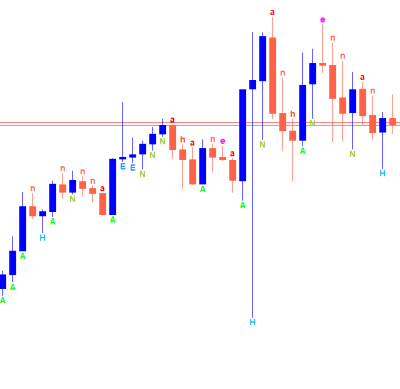 B: After the indicator is applied to the chart |
Figure 1: Before-and-After scenario.
Once the candles have been converted into symbols on the chart, we can ask questions such as:
- Which candlestick symbols occur most frequently?
- What symbol tends to follow another symbol?
- What are the most frequent two-, three-, and four-candlestick sequences?
- Does a particular sequence occur more frequently before a bullish or bearish movement?
- How does the distribution change between different instruments?
These questions move the analysis from visual chart interpretation toward statistical pattern analysis.
Indicator Architecture and Design
The next stage is to develop an MQL5 indicator that encodes candlesticks automatically and displays the symbols on the trading chart. The indicator will:
- Analyze historical and incoming candlesticks.
- Apply the established candlestick classification rules.
- Assign the appropriate encoded symbol to each candle.
- Display the encoded symbols directly on the chart.
- Maintain the sequence as new candles are formed.
- Calculate and present relevant statistical information over a user-defined number of candlesticks.
This provides a bridge between the statistical research conducted in the earlier parts of the series and practical visual analysis within MetaTrader 5.
Rather than exporting the encoded sequence and analyzing it separately, the trader will be able to observe the symbolic representation while monitoring the market in real time.
Code Walkthrough
- Indicator Properties
#property indicator_chart_window
#property indicator_buffers 0
#property indicator_plots   0
Indicator chart window places the indicator directly on the price chart rather than in a separate panel. Because the indicator communicates entirely through chart objects, such as text labels, and the Comment() function rather than plotted buffers, we declare zero buffers and zero plots. Therefore, there is nothing for the MQL5 plotting engine to render automatically.
- The Candle Filter Enum and Inputs
//+------------------------------------------------------------------+
//| Inputs                                                           |
//+------------------------------------------------------------------+
enum ENUM_CANDLE_FILTER
  {
   FILTER_ALL = 0,    // Show all types
   FILTER_Aa,         // A - Bullish Marubozu : a - Bearish Marubozu
   FILTER_Hh,         // H - Bullish Hammer   : h - Bearish Hammer
   FILTER_Ee,         // E - Bullish long upper wick : e - Bearish long upper wick
   FILTER_Gg,         // G - Bullish spinning top : g - Bearish spinning top
   FILTER_D,          // D - Doji
   FILTER_Nn          // N - Bullish unclassified : n - Bearish unclassified
  };

input string             Inp_Section1        = "===== Display Settings =====";
input ENUM_CANDLE_FILTER InpFilter           = FILTER_ALL;   // Candle type to display
input int                InpLookback         = 100;          // Lookback period
input int                InpFontSize         = 6;            // Label font size
input bool               InpShowComment      = true;         // Show probability report

input string            Inp_Section2        = "===== Candle Colours =====";
input color InpColorA = clrLime;         // A  Bullish Marubozu colour
input color InpColora = clrRed;          // a  Bearish Marubozu colour
input color InpColorH = clrDeepSkyBlue;  // H  Bullish Hammer colour
input color InpColorh = clrOrangeRed;    // h  Bearish Hammer colour
input color InpColorE = clrDodgerBlue;   // E  Bullish long-upper-wick colour
input color InpColore = clrMagenta;      // e  Bearish long-upper-wick colour
input color InpColorG = clrGold;         // G  Bullish spinning-top colour
input color InpColorg = clrDarkOrange;   // g  Bearish spinning-top colour
input color InpColorD = clrSilver;       // D  Doji colour
input color InpColorN = clrYellowGreen;  // N  Bullish unclassified colour
input color InpColorn = clrTomato;       // n  Bearish unclassified colour
At this stage, we define the available candle-type filters to make symbol selection easier. The FILTER_ALL option displays all symbols generated by the CandleType() function, while the individual filter options allow the user to display a specific candlestick type.
The indicator also provides several display settings, including the lookback period, font size, and an option to show or hide the statistical report on the chart. In addition, users can customize the colour of each encoded symbol, making the different candlestick categories easier to distinguish visually.
//-- Global variables                                                         |
string g_prefix = "";   // indicator unique object prefix
int    g_typeCount = 11;
string g_typeCodes[11] = {"A","a","H","h","E","e","G","g","D","N","n"};
string g_typeNames[11] = {"Bullish Marubozu","Bearish Marubozu","Bullish Hammer","Bearish Hammer",
                           "Bullish Long-Upper-Wick","Bearish Long-Upper-Wick","Bullish Spinning Top",
                           "Bearish Spinning Top","Doji","Bullish unclassified","Bearish unclassified"};
The global variables define the basic information required to manage and display the encoded candlestick symbols. The g_prefix variable stores a unique prefix used to identify the indicator's chart objects, while g_typeCodes[] contains the 11 encoded candlestick symbols. The corresponding g_typeNames[] array stores the descriptive name of each symbol. The g_typeCount variable stores the total number of available candlestick types, which is 11 in the expanded taxonomy.
- CandleType() — The Classification Engine
//+------------------------------------------------------------------+
//| Candle Type labeling function                                    |
//+------------------------------------------------------------------+
string CandleType(int shift)
  {
   //--- Get price data for the specified candle
   double open  = iOpen(_Symbol, _Period, shift);
   double close = iClose(_Symbol, _Period, shift);
   double high  = iHigh(_Symbol, _Period, shift);
   double low   = iLow(_Symbol, _Period, shift);
   //--- Calculate candle components
   double body      = MathAbs(close - open);
   double upperWick = high - MathMax(open, close);
   double lowerWick = MathMin(open, close) - low;
   //--- Return doji if open equals close
   if(close == open) return "D";
   //--- Determine direction once
   bool isBullish = (close > open);
   //--- Return the correct label
   return (body > 1.5 * upperWick && body > 1.5 * lowerWick)   ? (isBullish ? "A" : "a") :
          (lowerWick > 2.5 * body && lowerWick > 2 * upperWick)? (isBullish ? "H" : "h") :
          (upperWick > 2.5 * body && upperWick > 2 * lowerWick)? (isBullish ? "E" : "e") :
          (2 * body < upperWick && 2 * body < lowerWick)       ? (isBullish ? "G" : "g") :
          (isBullish ? "N" : "n");
  }
The CandleType() function classifies each candlestick into one of the predefined encoded symbols. It accepts the candlestick position (shift) as an input and retrieves its Open, High, Low, and Close (OHLC) prices.
Using these price values, the function calculates the candle body, upper wick, and lower wick, then applies the predefined classification rules. It first identifies a Doji (D) when the opening and closing prices are equal. For other candles, it determines whether the candle is bullish or bearish and assigns the corresponding uppercase or lowercase symbol.
If a candle does not satisfy any of the predefined conditions for A/a, H/h, E/e, or G/g, it is classified as N for bullish or n for bearish. This ensures that every candlestick receives a meaningful symbol within the expanded taxonomy.
- GetTypeColor() — Symbol-to-Colour Mapping
//+------------------------------------------------------------------+
//| Return colour assigned to a given type code                      |
//+------------------------------------------------------------------+
color GetTypeColor(string code)
  {
   switch(StringGetCharacter(code, 0))
     {
      case 'A':
         return InpColorA;
      case 'a':
         return InpColora;
      case 'H':
         return InpColorH;
      case 'h':
         return InpColorh;
      case 'E':
         return InpColorE;
      case 'e':
         return InpColore;
      case 'G':
         return InpColorG;
      case 'g':
         return InpColorg;
      case 'D':
         return InpColorD;
      case 'N':
         return InpColorN;
      case 'n':
         return InpColorn;
      default:
         return clrWhite;
     }
  }
The GetTypeColor() function assigns a colour to each encoded candlestick symbol based on the colour settings defined by the user in the indicator inputs. Each of the 11 symbols has a default colour to make the different candlestick types easily distinguishable on the chart. However, users can customize these colours according to their preferences. If an unrecognized symbol is encountered, the function returns white as the default colour.
- Filter Functions
//+------------------------------------------------------------------+
//| Return the set of codes the current filter allows.               |
//+------------------------------------------------------------------+
string GetFilterCodes()
  {
   switch(InpFilter)
     {
      case FILTER_Aa:
         return "Aa";
      case FILTER_Hh:
         return "Hh";
      case FILTER_Ee:
         return "Ee";
      case FILTER_Gg:
         return "Gg";
      case FILTER_D:
         return "D";
      case FILTER_Nn:
         return "Nn";
      default:
         return ""; // ALL
     }
  }
The GetFilterCodes() function returns the symbol or group of symbols corresponding to the filter selected by the user. For example, selecting FILTER_Aa returns "Aa", while FILTER_Nn returns "Nn". The FILTER_D option returns only "D" for Doji candles. When FILTER_ALL is selected, the function returns an empty string, indicating that all candlestick types should be displayed.
//+------------------------------------------------------------------+
//| Label describing the active filter (for header)                  |
//+------------------------------------------------------------------+
string GetFilterLabel()
  {
   switch(InpFilter)
     {
      case FILTER_Aa:
         return "A/a  Marubozu (Bullish / Bearish)";
      case FILTER_Hh:
         return "H/h  Hammer (Bullish / Bearish)";
      case FILTER_Ee:
         return "E/e  Long Upper Wick (Bullish / Bearish)";
      case FILTER_Gg:
         return "G/g  Spinning Top (Bullish / Bearish)";
      case FILTER_D:
         return "D  Doji";
      case FILTER_Nn:
         return "N/n  Unclassified (Bullish / Bearish)";
      default:
         return "ALL TYPES";
     }
  }
The GetFilterLabel() function returns a descriptive label for the candlestick filter selected by the user. It converts the selected filter into a human-readable description, such as "A/a Marubozu (Bullish / Bearish)" or "N/n Unclassified (Bullish / Bearish)". When no specific filter is selected, it returns "ALL TYPES", indicating that all encoded candlestick symbols will be displayed.
//+------------------------------------------------------------------+
//| Check validity of a given candle code against active filter      |
//+------------------------------------------------------------------+
bool PassesFilter(string code, string filterCodes)
  {
   if(filterCodes == "")
      return true;   // ALL
   return (StringFind(filterCodes, code) >= 0);
  }
The PassesFilter() function determines whether a candlestick symbol meets the currently selected filter. It compares the symbol code with the specified filterCodes and returns true if the symbol is included in the filter. When filterCodes is empty, the function assumes that all candlestick types are allowed. Otherwise, StringFind() is used to check whether the specified symbol exists within the selected filter codes.
- RemoveAllObjects — Safe Cleanup
//+------------------------------------------------------------------+
//| Remove every chart object created by this indicator instance     |
//+------------------------------------------------------------------+
void RemoveAllObjects()
  {
   for(int i = ObjectsTotal(0, -1, -1) - 1; i >= 0; i--)
     {
      string nm = ObjectName(0, i, -1, -1);
      if(StringFind(nm, g_prefix) == 0)
         ObjectDelete(0, nm);
     }
  }
The RemoveAllObjects() function removes all chart objects created by the indicator instance. It scans through the objects on the current chart and identifies those whose names begin with the indicator's unique g_prefix. Matching objects are then deleted, ensuring that objects created by other indicators or manually by the user remain unaffected.
- LabelName() — Create Unique Object Name
//+------------------------------------------------------------------+
//| Object name for a given shift inside the lookback window.        |
//+------------------------------------------------------------------+
string LabelName(int shift)
  {
   return g_prefix + "S" + IntegerToString(shift);
  }
The LabelName() function generates a unique object name using the candle's shift/index within the lookback window. This indexed naming approach allows the same chart object to be reused and updated by DrawLabel() function as the lookback window moves.
- DrawLabel() — Placing a Symbol on the Chart
//+------------------------------------------------------------------+
//| Draw / update the label that belongs to a given shift            |
//+------------------------------------------------------------------+
void DrawLabel(int shift, string code)
  {
   datetime barTime = iTime(_Symbol, _Period, shift);
   string   name    = LabelName(shift);   // indexed name

   bool   isBullish = (iClose(_Symbol, _Period, shift) > iOpen(_Symbol, _Period, shift));
   double offset    = _Point * 0.5;

   double price;
   ENUM_ANCHOR_POINT anchor;

   if(code == "D")
     {
      price  = iHigh(_Symbol, _Period, shift) + offset;
      anchor = ANCHOR_LOWER;
     }
   else
      if(isBullish)
        {
         price  = iLow(_Symbol, _Period, shift) - offset;
         anchor = ANCHOR_UPPER;
        }
      else
        {
         price  = iHigh(_Symbol, _Period, shift) + offset;
         anchor = ANCHOR_LOWER;
        }

//--- Create once, then just move and retag it as the window scrolls.
   if(ObjectFind(0, name) < 0)
      ObjectCreate(0, name, OBJ_TEXT, 0, barTime, price);
   else
      ObjectMove(0, name, 0, barTime, price);

   ObjectSetString(0, name, OBJPROP_TEXT,        code);
   ObjectSetString(0, name, OBJPROP_FONT,        "Arial Bold");
   ObjectSetInteger(0, name, OBJPROP_FONTSIZE,    InpFontSize);
   ObjectSetInteger(0, name, OBJPROP_COLOR,       GetTypeColor(code));
   ObjectSetInteger(0, name, OBJPROP_ANCHOR,      anchor);
   ObjectSetInteger(0, name, OBJPROP_SELECTABLE,  false);
   ObjectSetInteger(0, name, OBJPROP_HIDDEN,      true);
  }
The DrawLabel() function displays the encoded candlestick symbol directly on the chart as a text object. It positions the label below the candle for bullish candles and above the candle for bearish and Doji candles, making the symbols easy to associate with their respective candlesticks.
Before creating a new label, the function checks whether an object with the same name already exists. If it exists, its position is updated; otherwise, a new text object is created. The function also applies the user-defined font size, colour, and font style to each symbol and prevents the label from being selected or accidentally modified on the chart.
- ShowFrequencyReport() — The Statistics Panel
//+------------------------------------------------------------------+
//| Build and display the frequency report          		     |
//+------------------------------------------------------------------+
void ShowFrequencyReport(int barsUsed, int &counts[])
  {
   if(!InpShowComment)
     {
      Comment("");
      return;
     }
   int total = 0;
   for(int i = 0; i < g_typeCount; i++)
      total += counts[i];
   string txt = "\n\n===== Candle Type Label =====\n";
   txt += "Symbol: " + _Symbol + "   Timeframe: " + PeriodToString(_Period) + "\n";
   txt += "Lookback: " + IntegerToString(barsUsed) + " candles   Filter: " + GetFilterLabel() + "\n";
   txt += "-------------------------------------------------\n";

//--  Produce statistical report
   for(int i = 0; i < g_typeCount; i++)
     {
      double pct = (total > 0) ? (100.0 * counts[i] / total) : 0.0;
      string label = g_typeCodes[i] + " - " + g_typeNames[i];
      txt += StringFormat("%-30s: %3d (%5.1f%%)\n\n", label, counts[i], pct);
     }
   txt += "-------------------------------------------------\n";
   txt += StringFormat("%-30s: %3d (%5.1f%%)\n", "Total candles used", total, 100.0);
   Comment(txt);
  }
The ShowFrequencyReport() function generates and displays the frequency and percentage statistics for the encoded candlestick symbols using MQL5’s Comment() function. It first checks whether the user has enabled the statistical report through the input setting. If disabled, the existing comment is cleared. When enabled, the function calculates the total number of candles analyzed and determines the frequency and percentage distribution of each encoded symbol within the selected lookback period. The report also displays the symbol, timeframe, lookback period, and active filter. The results are then formatted into a structured and readable report on the chart, providing an immediate statistical overview of the encoded candlestick distribution.
- PeriodToString Helper
//+------------------------------------------------------------------+
//| Helper: timeframe to readable string                             |
//+------------------------------------------------------------------+
string PeriodToString(ENUM_TIMEFRAMES p)
  {
   switch(p)
     {
      case PERIOD_M1:
         return "M1";
      case PERIOD_M5:
         return "M5";
      case PERIOD_M15:
         return "M15";
      case PERIOD_M30:
         return "M30";
      case PERIOD_H1:
         return "H1";
      case PERIOD_H4:
         return "H4";
      case PERIOD_D1:
         return "D1";
      case PERIOD_W1:
         return "W1";
      case PERIOD_MN1:
         return "MN1";
      default:
         return EnumToString(p);
     }
  }
The PeriodToString() function converts the selected chart timeframe from the MQL5 ENUM_TIMEFRAMES value into a short, readable string format. For example, it converts PERIOD_M15 to M15, PERIOD_H1 to H1, and PERIOD_D1 to D1. If the timeframe is not explicitly defined in the function, EnumToString() is used as a fallback.
- OnInit()— Setup
//+------------------------------------------------------------------+
//| Custom indicator initialization function                         |
//+------------------------------------------------------------------+
int OnInit()
  {
   // Unique prefix for different charts
   g_prefix = "CTL_" + _Symbol + "_" + IntegerToString((int)_Period) + "_" + IntegerToString((int)ChartID()) + "_";
   IndicatorSetString(INDICATOR_SHORTNAME, "CandleTypeLabel (" + IntegerToString(InpLookback) + ")");
   return(INIT_SUCCEEDED);
  }
The OnInit() function performs the initial setup of the indicator. It creates a unique object prefix using the current symbol, timeframe, and chart ID. Every text-label object created by the indicator uses this prefix in its name, ensuring that multiple instances running on different charts do not interfere with one another or modify each other’s objects. The function also sets the indicator’s short name, incorporating the selected lookback period, so that the indicator can be easily identified in the MetaTrader interface.
- OnDeinit() — Cleanup
//+------------------------------------------------------------------+
//| Custom indicator deinitialization function                       |
//+------------------------------------------------------------------+
void OnDeinit(const int reason)
  {
   RemoveAllObjects();
   Comment("");
   ChartRedraw();
  }
The OnDeinit() function performs the indicator’s cleanup operations when it is removed from the chart or the chart is closed. It calls RemoveAllObjects() to delete all text-label objects created by the indicator, clears the statistical report using Comment(""), and then refreshes the chart with ChartRedraw(). This ensures that the indicator leaves no residual objects or comment text behind after deinitialization.
- OnCalculate() — The Main Engine
//+------------------------------------------------------------------+
//| Custom indicator iteration function                              |
//+------------------------------------------------------------------+
int OnCalculate(const int rates_total,
                const int prev_calculated,
                const datetime &time[],
                const double &open[],
                const double &high[],
                const double &low[],
                const double &close[],
                const long &tick_volume[],
                const long &volume[],
                const int &spread[])
  {
//--- Run only when a new completed candle exists
   static datetime lastBarTime = 0;
   datetime currentBarTime = iTime(_Symbol, _Period, 0);
   if(currentBarTime == lastBarTime)
      return(rates_total);
   lastBarTime = currentBarTime;

   int lookback = MathMin(InpLookback, rates_total - 1);
   if(lookback < 1)
      return(rates_total);

   int counts[11];
   ArrayInitialize(counts, 0);
   string filterCodes = GetFilterCodes();

//---  Each shift owns exactly one name, so overwriting shift N automatically
//---  discards whatever the previous bar at shift N used to be.
   for(int shift = lookback; shift >= 1; shift--)
     {
      string code = CandleType(shift);
      //--- tally for the frequency report (counts every type, regardless of filter)
      for(int i = 0; i < g_typeCount; i++)
        {
         if(g_typeCodes[i] == code)
           {
            counts[i]++;
            break;
           }
        }
      if(PassesFilter(code, filterCodes))
         DrawLabel(shift, code);
      else
         ObjectDelete(0, LabelName(shift));   // ensure a filtered-out slot is cleared
     }

   ShowFrequencyReport(lookback, counts);
   ChartRedraw();
   return(rates_total);
  }
OnCalculate() is the indicator's core processing routine. Although it is called by MetaTrader on every incoming tick, the code is deliberately designed to perform its main operations only when a new candlestick appears. It compares the current completed-bar time with the previously processed bar and exits immediately if no new bar is available. This avoids repeatedly scanning and redrawing the same candles on every tick, improving the indicator's efficiency. The lookback period is also limited to the amount of historical data currently available, preventing the indicator from attempting to access unavailable candles.
For each candle within the selected lookback period, the function:
- Uses CandleType() to determine its encoded symbol.
- Updates the frequency count for that symbol, regardless of the selected display filter. This ensures that the statistical report represents the complete sample.
- Uses PassesFilter() to determine whether the symbol should be displayed on the chart.
- Calls DrawLabel() to display the symbol when it satisfies the active filter.
After processing the selected candles, ShowProbabilityReport() generates the frequency and percentage report, while ChartRedraw() forces the chart to refresh immediately.
OnCalculate() coordinates the workflow: it detects a new bar, classifies candles, computes statistics, applies the filter, draws symbols, and refreshes the chart.
Figure 2 presents the overall code-flow architecture of the indicator, illustrating how the main functions interact to classify, filter, display, and statistically analyze the encoded candlestick series.
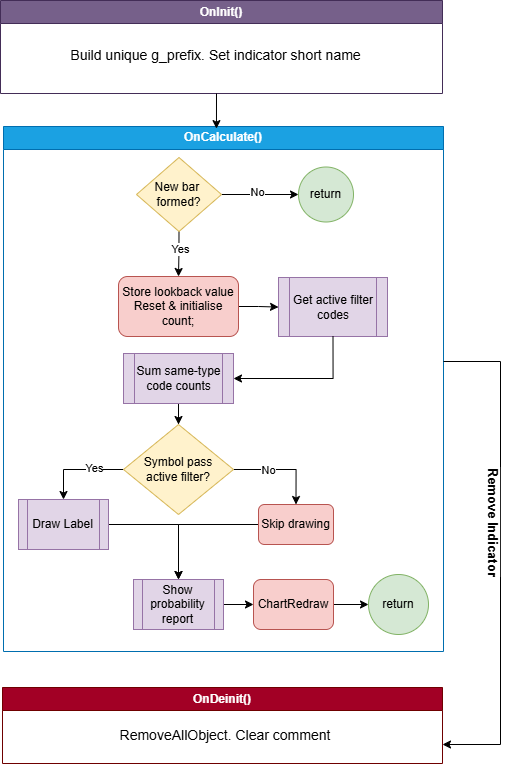
Figure 2: Code Architecture
Indicator Demonstration
Now that the indicator development is complete, the source code is attached to this article for download.
To install the indicator, open the MetaTrader 5 terminal and select File → Open Data Folder. Navigate to the MQL5 folder and open the Indicators subfolder. Copy the downloaded Market DNA_v3 source file into this folder.
Return to the MetaTrader 5 terminal and refresh the Navigator panel. The indicator should now appear under Indicators.
Attach Market DNA_v3 to the desired chart and adjust the available input parameters according to your preference. The indicator will then display the encoded candlestick symbols and statistical information directly on the chart, as demonstrated in Figures 3 and 4.
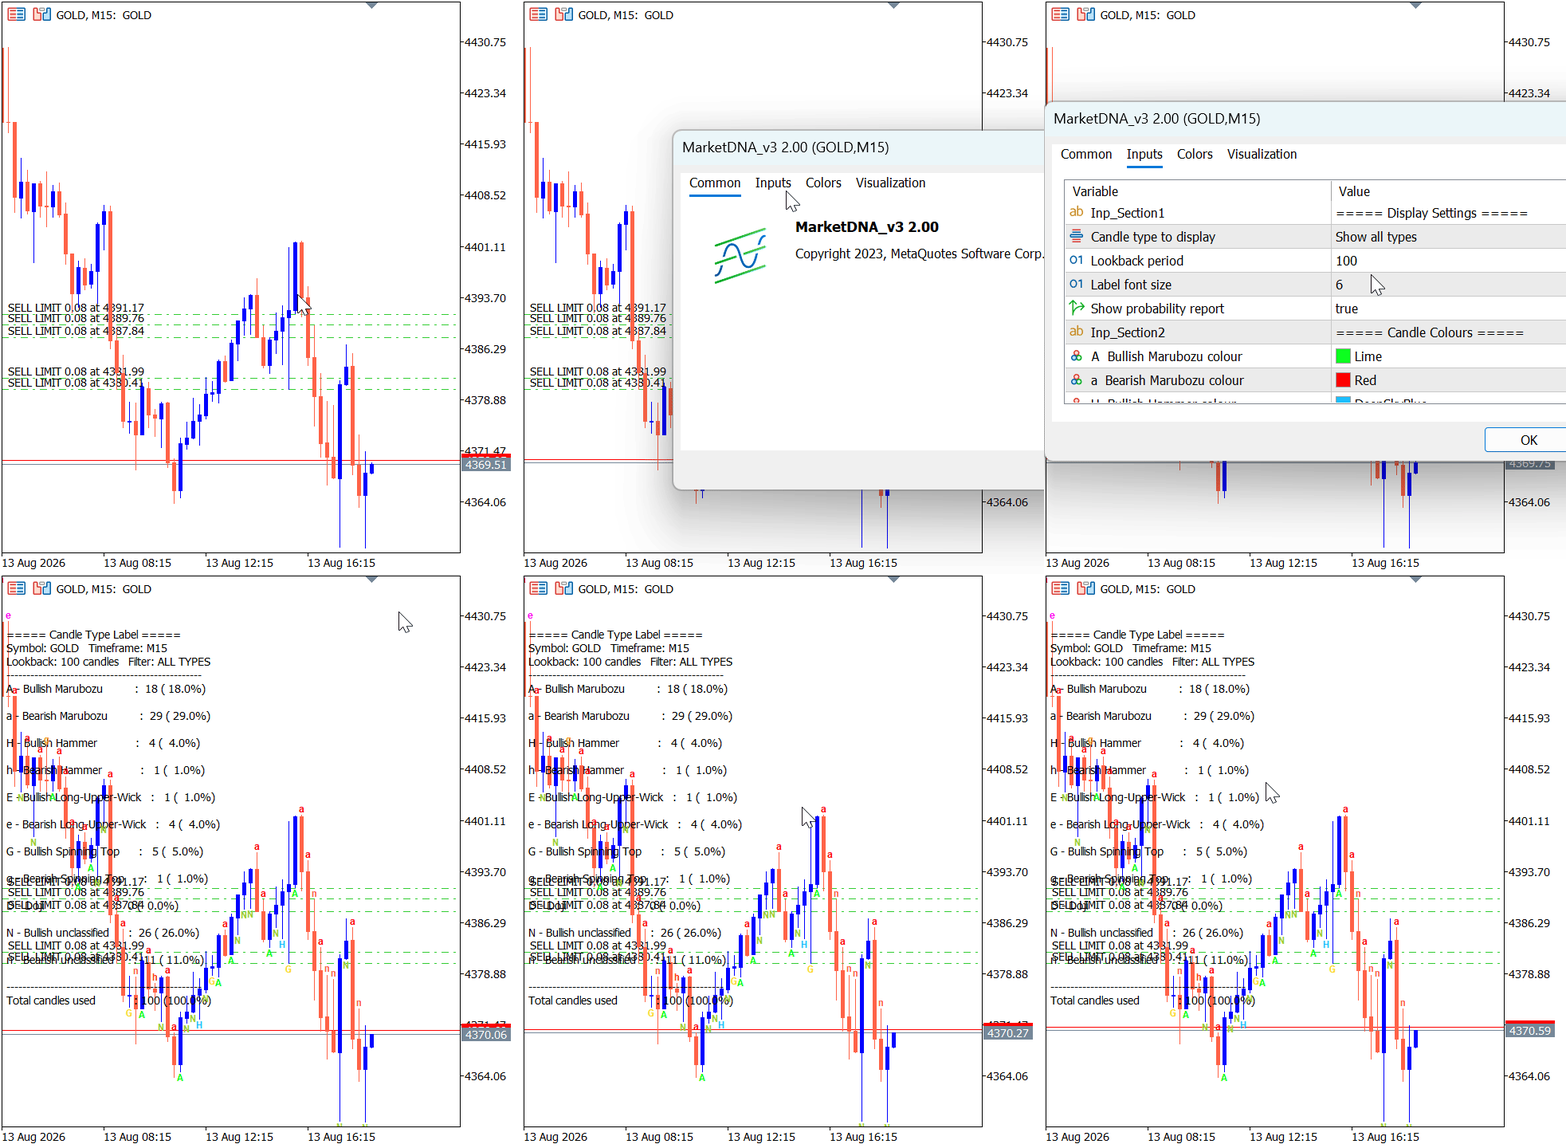
Figure 3: Market DNA demo 1
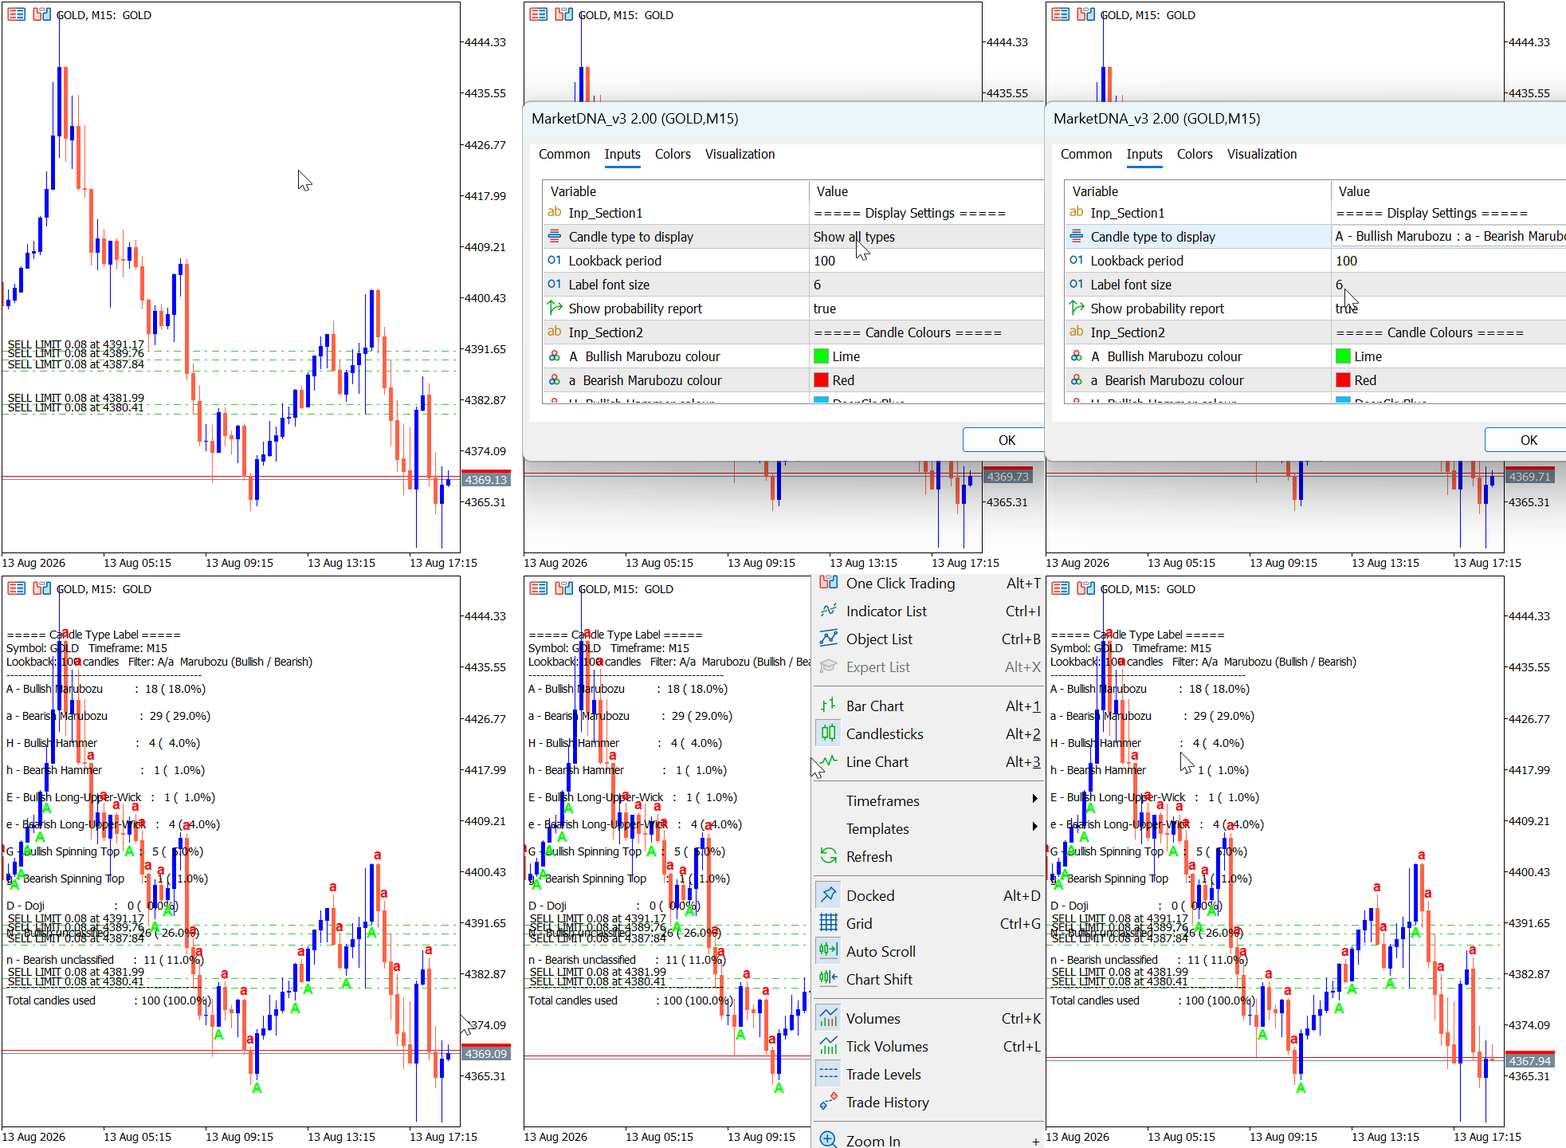
Figure 4: Market DNA demo 2
Conclusion
In this part of the series, we have taken another important step in the development of the candlestick encoding framework by moving from offline statistical analysis to live visual representation. We developed the Market DNA_v3 indicator for MetaTrader 5 to display the encoded candlestick sequence directly on the trading chart.
The expanded taxonomy introduced in Part 5, including N and n for bullish and bearish unclassified candles, ensures that directional information is retained even when a candle does not satisfy the predefined classification rules. The indicator therefore provides a compact and informative representation of price action through a strong compression of candlestick data, while allowing users to filter specific candle types, customize symbol colours and font sizes, select the lookback period, and view the frequency and percentage distribution of the encoded symbols.
More importantly, the indicator turns the price chart into a 'language of the market': a continuous symbol stream that captures successive candlestick structures. This representation provides another perspective from which traders and researchers can observe recurring sequences, transitions, and relationships that may be difficult to identify from conventional candlestick or bar charts alone.
The encoded sequence displayed by the indicator is designed to be human-readable, while the `.txt` file representation in Part 5 is structured for machine processing and automated analysis. This creates an important foundation for further quantitative research, including multi-candlestick pattern analysis, frequency and probability modelling, Markov-chain analysis, sequence prediction, and the development of automated trading strategies.
However, the visual presence of a recurring pattern does not by itself establish that the pattern has predictive or trading value. The next stage of this research will therefore focus on statistically evaluating the encoded sequences and investigating whether the information contained in previous symbols can provide useful insight into the probability of the next candle structure.
In the next chapter, we will continue exploring the advantages of the encoded sequence framework in MQL5, with particular emphasis on sequence-based analysis, next-candle prediction, and its potential application in automated trading systems.
Warning: All rights to these materials are reserved by MetaQuotes Ltd. Copying or reprinting of these materials in whole or in part is prohibited.
This article was written by a user of the site and reflects their personal views. MetaQuotes Ltd is not responsible for the accuracy of the information presented, nor for any consequences resulting from the use of the solutions, strategies or recommendations described.

 Neural Networks in Trading: From Transformers to Spiking Neurons (Key Components)
 Regime Discovery by Structure: Implementing Toeplitz Inverse Covariance Clustering (TICC)
 Building AI-Powered Trading Systems in MQL5 (Part 12): Giving the Assistant Chart Vision and Tool Access
 Uncertainty as a Model (Part 3): Mathematical Statistics — How to Extract Knowledge from Data

- Free trading apps
- Over 8,000 signals for copying
- Economic news for exploring financial markets
You agree to website policy and terms of use