Discussing the article: "Developing Advanced ICT Trading Systems: Implementing Order Blocks in an Indicator"
Good day Mendoza
Thank you for this effort.
my question is ; since we are using OnCalculate function :
int OnCalculate(const int rates_total,
const int prev_calculated,
const datetime &time[],// TimeSeries of Open times
const double &open[], // TimeSeries of Open Prices
const double &high[],// TimeSeries of High Prices
const double &low[],// TimeSeries of Low Prices
const double &close[],// TimeSeries of Close Prices
const long &tick_volume[],// TimeSeries of tick volume
const long &volume[],// TimeSeries of Bar Prices
const int &spread[])//
Why should we create new arrays and rearrange them ?
datetime  mitigados_alcsitas(double price, const double &lowArray[], const  datetime &Time[], datetime start, datetime end)
 {
  int startIndex = iBarShift(_Symbol, PERIOD_CURRENT, start);
  int endIndex = iBarShift(_Symbol, PERIOD_CURRENT, end);

  NormalizeDouble(price, _Digits);
  for(int i = startIndex - 2 ; i >= endIndex + 1 ; i--)
   {
    if(price > lowArray[i])
     {
      return Time[i]; //si encuentra que si hubo retorna el tiempo de la vela donde hubo la mitigacion
      Print("el orderblock tuvo mitigaciones", TimeToString(end));
     }
   }

  return 0; //En caso no se haya encontrado niguna mitigacion retorna 0
 }
And so on in four neighbouring functions.
Hi, you're absolutely right. I was wrong about thinking NormalizeDouble worked by reference. It actually returns a rounded value, and for a variable to take that value, you have to explicitly assign it to it. Sorry about that; I think I learned it that way when I wrote that code and that's how it stuck. I'm really sorry. I'm using NormalizeDouble here more as a precaution, although I don't think it has a significant impact on checking whether a bullish order block was mitigated (based on my testing). Thanks for pointing that out. We could choose to assign "price = NormalizeDouble(price, _Digits)" directly, or delete that line, since normalization doesn't seem to significantly affect the review.
Hello Ahmed, thank you very much for your comment. You're right. There's no need to create new arrays, because the OnCalculate function already gives us all the data ready to use. I did it out of habit at the time, but it's best to work directly with the data that's already there. By the way, if you want the most up-to-date code, I'll leave it here for you. In this new code, the arrays that already come by default are used, the logic for detecting the order blocks is the same.
Hello Ahmed, thank you very much for your comment. You're right. There's no need to create new arrays, because the OnCalculate function already gives us all the data ready to use. I did it out of habit at the time, but it's best to work directly with the data that's already there. By the way, if you want the most up-to-date code, I'll leave it here for you. In this new code, the arrays that already come by default are used, the logic for detecting the order blocks is the same.
There is another reason for creating separate arrays. If you decide to incorporate the logic into an EA, there is no OnCalculate function. Also if you desire to make a multi currency or multi time frame versions, you will need multiple arrays or multi demen arrays and 90% of the work is already done.
My question is why do most developers turn the data into time series? I converted an MQ4 EA into MQ5 and did not realize the time series was available so I kept all arrays as zero bases, not as time series. I found it makes life a lot easier as there is a 1 to 1 correspondence between the data and the supporting arrays, no more resetting, resizing and resetting back again for time series, only resizing and finally most importantly just 1 bar numbering system. For those Metaquotes functions that Insist on a time series I do the reverse indixing at the call.
Hi Again, I just downloaded your source, version 1, compiled and applied to anH4 EURUSD chart and nothing appeared. I went to the properties panel, changed nothing and closed and the png appeared. Only Green bars, no red, and onc they start, they do mot terminate. Any suggestions? I downloaded the Part2 from the discussion above and that had generally the same issues but with three newer ones as well. The start stop green red problems were evident. It seems in addition, there were different criteria as the number of bands did not exactly match. In addition, I tried to change the green color to clrLime and it changed but was definately not Lime.
Also, How do you make the animation. Are you using the Strategy Tester? I ask because I cannot get the Strategy Tester to display correctly on the screen when testing an EA in visual mode, or when testing an indicator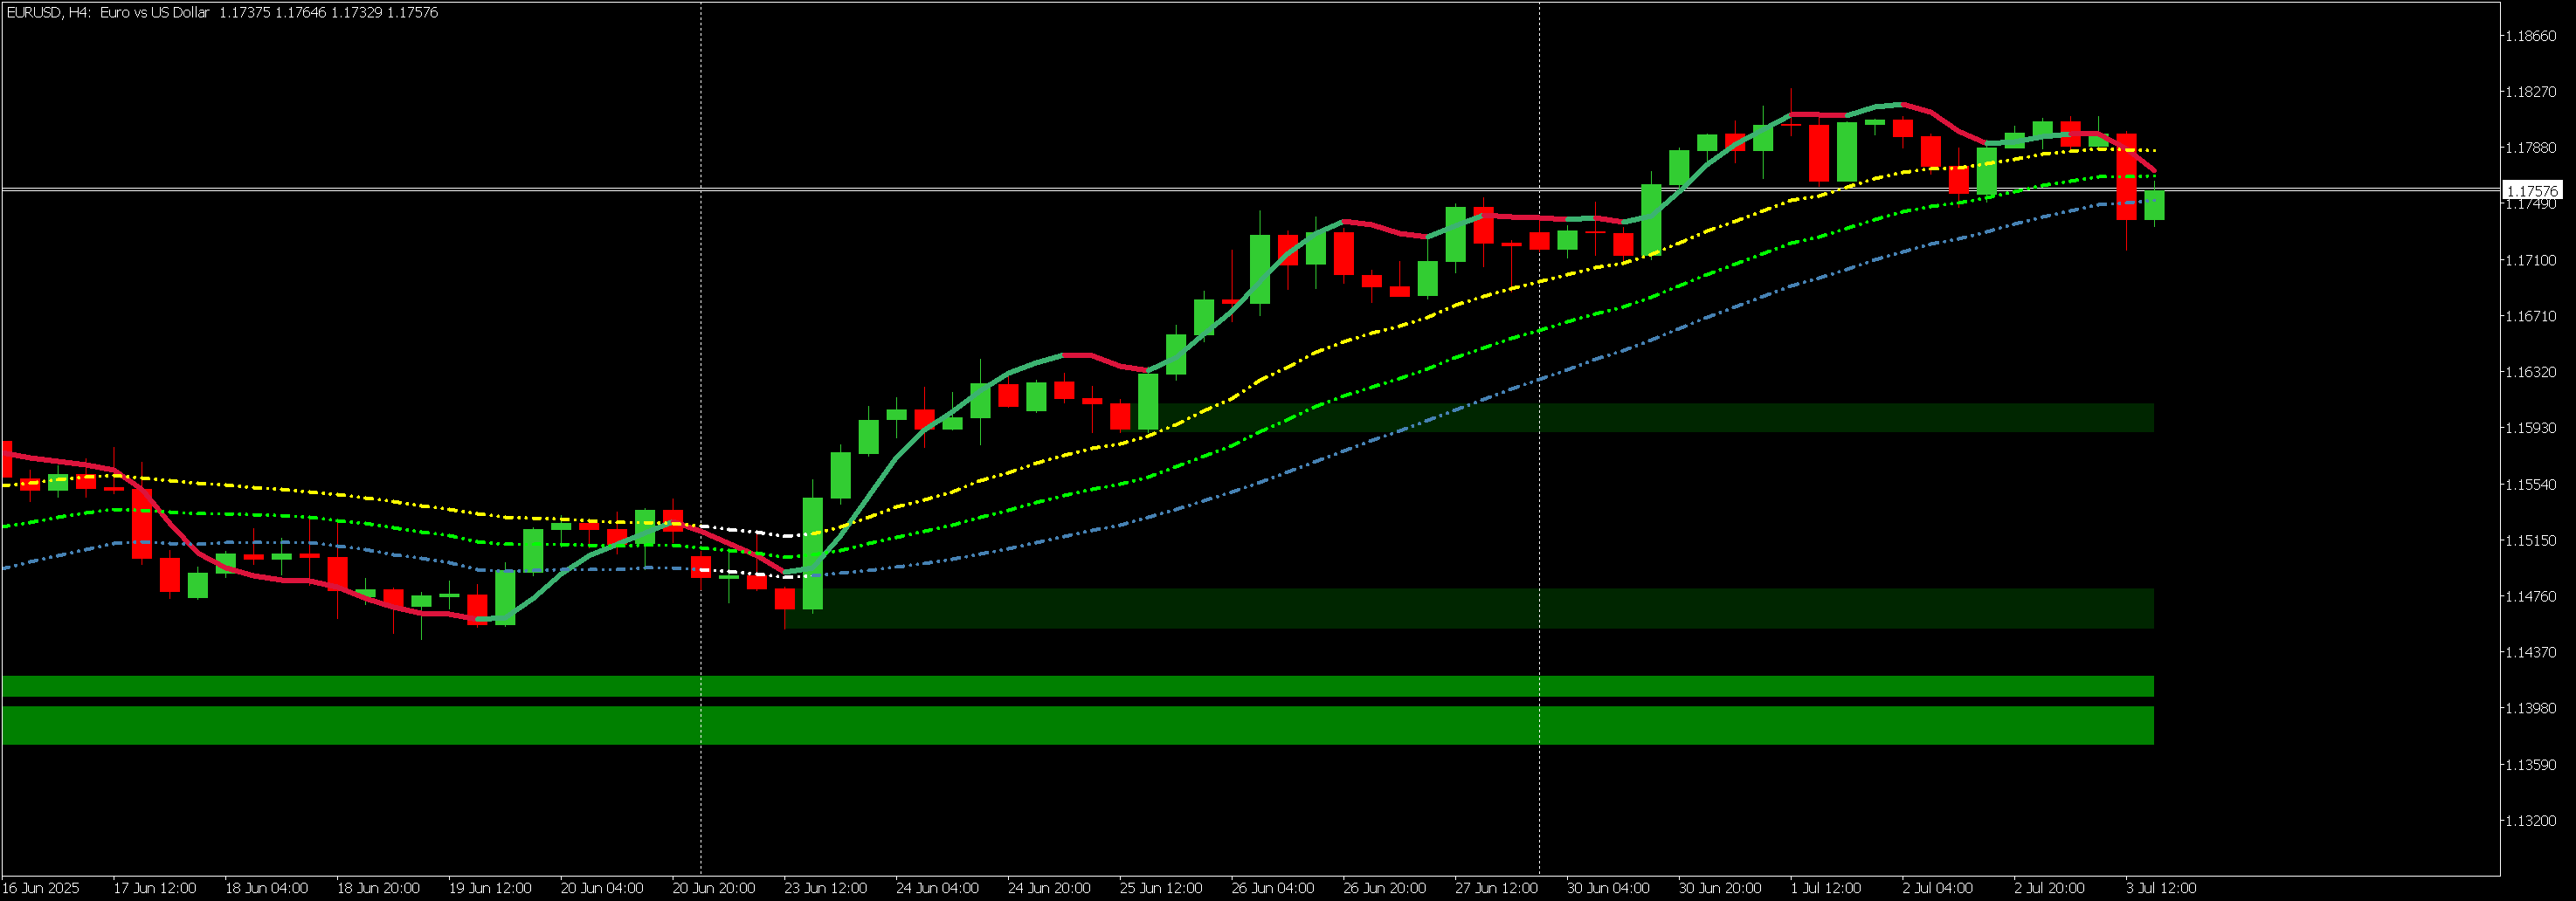
Hi Niquel,
I am attaching a slightly revised version of your part 2.
I added ErrorDescription(errornumber) which is in STDLIB.EX5 to expand on your various error messages. For some reason, I could not put the import directly into the indicator so my workaround was to include it in an include file BlockOrder Common.mqh where it does work for me. Can you run the indicator through Google Translate to convert the text into English?
I also added a version number,2.01, to the program. Using the define, I added the version number as a prefix for RectangleCreate to enable running version 1 & 2 together althoug I did not change version 1.
As a suggestion, you could calculate a Moving average on the volumes and display it at the bottom of the screen. I presume some decimal adjustment will be necessary.
I'm looking forward to your next update
CapeCoddah
There is another reason for creating separate arrays. If you decide to incorporate the logic into an EA, there is no OnCalculate function. Also if you desire to make a multi currency or multi time frame versions, you will need multiple arrays or multi demen arrays and 90% of the work is already done.
My question is why do most developers turn the data into time series? I converted an MQ4 EA into MQ5 and did not realize the time series was available so I kept all arrays as zero bases, not as time series. I found it makes life a lot easier as there is a 1 to 1 correspondence between the data and the supporting arrays, no more resetting, resizing and resetting back again for time series, only resizing and finally most importantly just 1 bar numbering system. For those Metaquotes functions that Insist on a time series I do the reverse indixing at the call.
Hi CapeCoddah, In my case, I usually use arrays in the form of time series to work with price data or indicators, mainly for convenience and out of habit. However, I recognize that this isn't always the best reason to use them. For indicators, it can often be more practical to work with zero-based arrays, as they simplify index management and reduce the need for constant reinitialization or resizing. In my case, when programming the order blocks indicator, I chose to use time series because that's how I structured the order block retrieval from the start.
Hi Again, I just downloaded your source, version 1, compiled and applied to anH4 EURUSD chart and nothing appeared. I went to the properties panel, changed nothing and closed and the png appeared. Only Green bars, no red, and onc they start, they do mot terminate. Any suggestions? I downloaded the Part2 from the discussion above and that had generally the same issues but with three newer ones as well. The start stop green red problems were evident. It seems in addition, there were different criteria as the number of bands did not exactly match. In addition, I tried to change the green color to clrLime and it changed but was definately not Lime.
Also, How do you make the animation. Are you using the Strategy Tester? I ask because I cannot get the Strategy Tester to display correctly on the screen when testing an EA in visual mode, or when testing an indicatorRegarding the first problem, I think it could be due to the indicator not loading the data correctly. This usually happens when changing charts or opening a new one. However, if it is a chart that was already in use, it would be worth investigating further why the order blocks are not being obtained. In that case, it would be useful to include debug (Print) messages in the code to identify the problem.
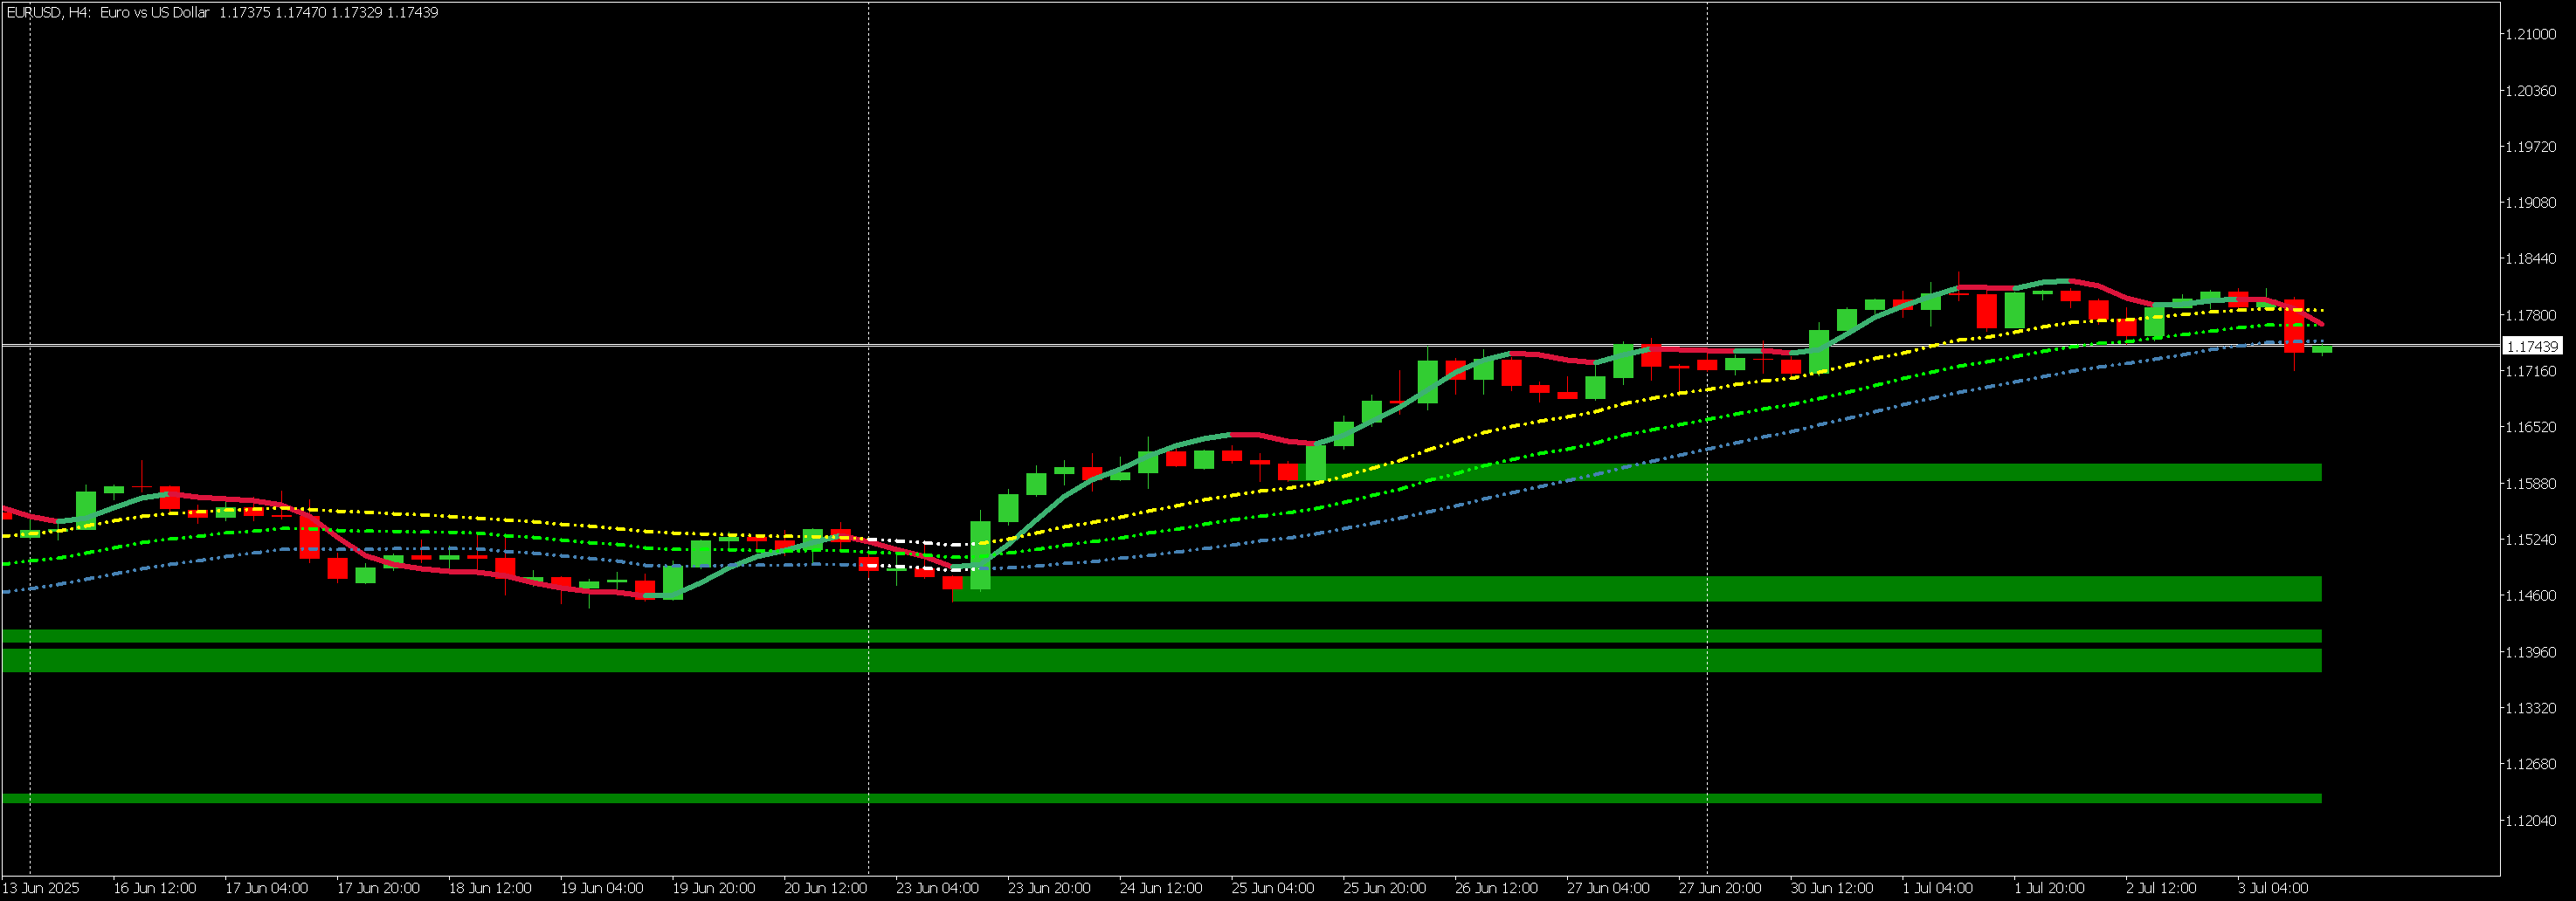
Regarding the second problem, where only bullish order blocks are drawn, it could be because the EURUSD in the H4 timeframe is currently at 600-700 candlestick highs. In that context, it is possible that all the bearish order blocks have been mitigated, which is why they are not drawn on the chart.
Regarding the criteria change, I reduced some Boolean variables in the code. However, it would not be a problem to reintroduce those conditions if necessary.
Regarding the colors, the latest version I posted in the comments applies transparency to the colors of the order block rectangles. Perhaps that's why the colors don't visually match those of previous versions. Finally, regarding the animation, I didn't quite understand what you were referring to. Could you explain in more detail what you mean by animation in this context?
Hi CapeCoddah, In my case, I usually use arrays in the form of time series to work with price data or indicators, mainly for convenience and out of habit. However, I recognize that this isn't always the best reason to use them. For indicators, it can often be more practical to work with zero-based arrays, as they simplify index management and reduce the need for constant reinitialization or resizing. In my case, when programming the order blocks indicator, I chose to use time series because that's how I structured the order block retrieval from the start.
I was just reviewing your code. When I was resizing arrays in MQ4, I found out That I had to Set time series for the array to false, resize and the reset time series to true. As I don't use it in MQ5, I don't know if it is still appropriate.
- Free trading apps
- Over 8,000 signals for copying
- Economic news for exploring financial markets
You agree to website policy and terms of use
Check out the new article: Developing Advanced ICT Trading Systems: Implementing Order Blocks in an Indicator.
Order Blocks are zones on the chart where pending orders are likely waiting to be filled.
This typically occurs when a large market participant, such as a financial institution, wants to enter a significant position but lacks sufficient liquidity to execute the entire order at once without impacting the market. According to the basic laws of supply and demand, executing a portion of the order drives the price higher (in the case of a buy) in an aggressive search for sellers who can provide the liquidity needed to complete the trade.
Because the institutional participant cannot execute the full order in one go without causing a substantial price shift, they break the order into smaller parts. This allows them to complete the trade without the price moving significantly before they've fully entered their position.
From this concept, we can identify these zones on a price chart as areas of strong imbalance between supply and demand (whether for buying or selling). Below, we'll explore three ways to identify these zones and how to implement them in code.
Author: Niquel Mendoza