
Show Must Go On, or Once Again about ZigZag

Introduction
A huge amount of ZigZag versions proves the existence of a constant and persistent interest in this indicator. A quite worthwhile interest. This is perhaps the only indicator that directly affects trader's emotions forcing the immediate actions with its bright vivid graphical representation of the main market movements. Apparently, this can be the only explanation of the phenomenon, with the majority's thorough understanding that this indicator is not intended for production of direct trading signals, nevertheless they continuously attempt to maximally approach it to the current market situation. Observing the endless redrawing of the last forecasting fracture is a doubtful advantage, especially when perceiving it.
Let's discourse a little. Believe it or not, but this is the beginning of everything.
Lyrics
All of us who came and STAYED on this market, sooner or later understand that it is not so simple as we thought at the beginning. As soon as we realize it, we start reading (those who can, of course). But, somehow, we perceive what we read very peculiarly. In short, we choose the simplest things, not the right ones. Correspondingly, we add to our armory only the things that lie superficially, that are obvious for understanding and can be easily (quickly) translated into an algorithmic language. There are many examples of that. Here is one of them, may be not the best one, but let's take it as it is.
Everybody knows and remembers the basic TA thesis that has not been disproved yet, but still not strictly proved, however:
Price is our Everything!
Taking this literally and head-on, we start searching for not the control points of the market, but by all means for its maximums and minimums - this is easier and clearer. We draw support/resistance levels with a ruler, count Fibo-levels from them, count the cycles in bars, etc. From bad to worse - we start picking up from somebody's trading system only the things that are accessible for our understanding without paying attention to warnings or to which market it is for and the time of creation of that system….. What is worse, we start simplifying...simplifying Gann (!!!), who, as I think, found (or was very close to it) the solution of the Price/Time problem... delirium...how is it possible to simplify something that has not been fully understood by anybody yet?
And then, when we realize that everything works wrongly somehow, a bit better than fifty-fifty, we start saying loud that Gurus are lying, their methods do not work, books are written only for the money, the golden section does not exist...etc. And this is the result of our forgetting that it is not the minimax synonym when we look at an extremum, but this really a maximum or a minimum, just another exhibition of its internal essence that we still need to reach for. So, on the basis of this shallow view, we try to forecast the future even not trying to analyze what made this point the one that it is right in this place right at this time.
Much as we should like to earn money, it does not strike us that sometimes we sometimes need to stop and think a little. It's a useful stuff you know. You start to perceive clearly the rightness of that "man is the only living creature that does the same thing over and over again expecting different results". We are not chopping wood, are we? :)
I'm too carried away by enthusiasm. Maybe, because it's about me, too. It's time to round off. Let's just understand that not all the gurus are Gurus, and the ones who are will never tell everything...the more especially as they know that a spoon-fed thing is not tasty nor of much help.
Back to the topic.
Multiframe Fractal ZigZag
I needed an indicator that wouldn't just represent minimums and maximums, but the market extremum points logically reasoned by price movements (LREP - can this abbreviation become naturalized perhaps?) and, if possible, confirmed. The problem of making it a trade signals generator wasn't stated initially. First of all, I tried to play with the standard (not the one embedded in MT4, but "standard" in a general sense) ZigZag, but there was something that had put me on the alert and forced to renounce this idea:
- the uniformity of all algorithms despite a plenty of discussions in the internet and the great variety of versions (by the way, perhaps the matter is in my eyes, but I've never met this algorithm clearly decoded anywhere);
- the absence of a single concept of "what" it should look for;
- disgustingly frequent and, what is worst, poorly predictable redrawing;
- direct dependence on the timeframe and/or on the previously specified price excursion;
As it concerns me personally, the last one is most unacceptable. It doesn't appeal to me. Nothing private.
I remember Demark with his TD points and Williams with his "fractals" (I don't know who has borrowed from whom, but they're like two peas in a pod). It seemed to be "the one" - it was reasoned at least with the previous and the subsequent price movements. Maybe, not everybody will like this kind of approach to the choosing of these points. However, nobody has invented anything more accurate and proper for their initial identification yet, except for terms like "valuable extremum", "local maximum", etc., of course.
The own things are perhaps not the better ones, but surely more "kindred" one. This is why I didn't look for a borrowed code and wrote my own simple fractal indicator, more accurately, its resemblance: the rules of points choosing slightly differ from the standard ones. I tried to call it with different timeframes using iCustom, but then understood that it would be more rational to calculate everything on the current (working) timeframe (TF). Further on, the programming logic prompted everything itself: and about the module construction that suggests itself in the future, and about the substandard TF. Here is the result of what has come out.
The pictures show its appearance with the TF parameters 1440, 360, 60. The H1 chart is chosen for its demonstrativeness to make you see that the black line (60) doesn't take all fractal points and rejects some of them. The first picture is to view the tip, and the second one is simply taken from the middle of the chart.
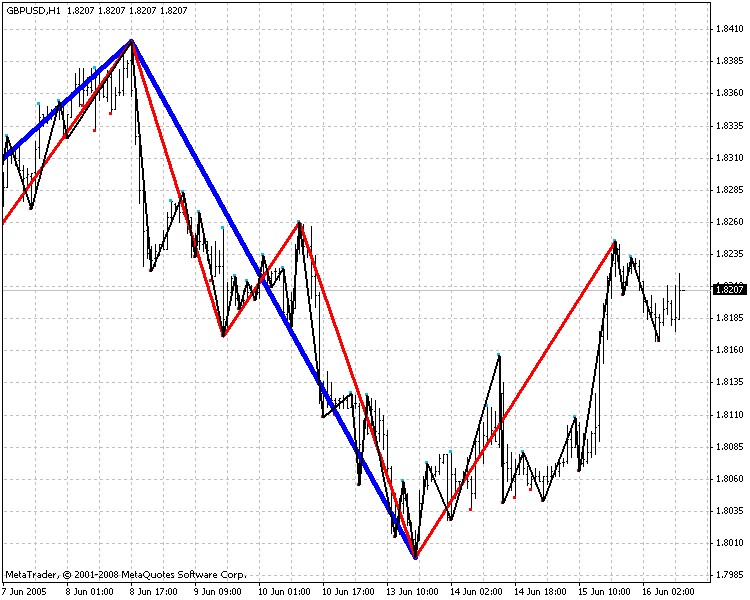
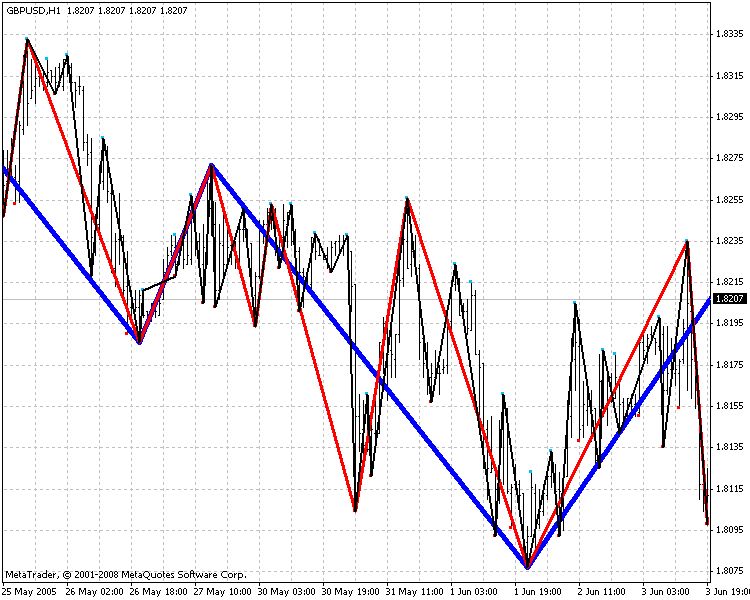
The color scheme is not the best one, the attached picture shows my view of it.
Code
Let's see how it is implemented - shouldn't we act in a dumb show? ;)
The indicator forms on the current working timeframe (TF) a sequence of ZigZag nodes that are calculated on the three emulated larger TFs. It works on all and with all TFs, including substandard ones with the following restrictions implemented in the code:
- the larger TF must be divisible by the working one; if it is not so, then the closest correct values are set forcibly;
- the working TF is not greater than the least larger TF;
- the periods in the parameters are specified in minutes and must be set in decreasing order;
- the period of the biggest TF doesn't exceed 43200 (one month) - that is not the limit, a bigger one is possible;
The feature is that only one buffer is used for each TF. There is no need to use two of them, because in the reasonable combination of TFs the probability of appearance of two differently directed extremums on a single bar of the working TF is too small.
Here is this fragment:
//-----------------------------------------------------------------------
// MF_Fractal_ZZ_3in1.mq4
//-----------------------------------------------------------------------
#property copyright "Copyright © 2008, BiViSi Corp."
#property link      "riderfin@bk.ru"
#property link      "ICQ 499949112"

#property indicator_chart_window
#property indicator_buffers 3
//---- style of the indicator line
#property indicator_color1 Blue
#property indicator_color2 Red
#property indicator_color3 Yellow
#property indicator_style1 0
#property indicator_style2 0
#property indicator_style3 0
#property indicator_width1 5
#property indicator_width2 3
#property indicator_width3 1
//---- INOUT PARAMETERS OF THE INDICATOR
extern int VolExt=50; // VolExt+1" calculation of the last control points
extern int TFLarge=1440;
extern int TFMidle=240;
extern int TFSmall=60;
//---- Variables
double Large[],Midle[],Small[];  // control points (indicator bufers)
datetime PrevTimePer[4];         // the time of the last calculation of every TF
datetime PrevTimeCalc=0;
double P60,CP60;
int CurPeriod, ErrorTF=0, NumberExt, Per,  largelast=0, midlelast=0, smalllast=0;
//-----------------------------------------------------------------------
int init()
{
   // initialization
   IndicatorBuffers(3); // for perspective" entry :)
   SetIndexBuffer(0,Large); SetIndexStyle(0,DRAW_SECTION);
   SetIndexEmptyValue(0,0.0);
   SetIndexBuffer(1,Midle); SetIndexStyle(1,DRAW_SECTION);
   SetIndexEmptyValue(1,0.0);
   SetIndexBuffer(2,Small); SetIndexStyle(2,DRAW_SECTION);
   SetIndexEmptyValue(2,0.0);
   ArrayInitialize(PrevTimePer,0);
   CurPeriod=Period(); CP60=CurPeriod*60;
   // restrictions:
   // control of TF and inputted parameters
   if (MathCeil(TFSmall/CurPeriod) != TFSmall/CurPeriod)
      TFSmall=MathCeil(TFSmall/CurPeriod)*CurPeriod;
   if (MathCeil(TFMidle/CurPeriod) != TFMidle/CurPeriod)
      TFMidle=MathCeil(TFMidle/CurPeriod)*CurPeriod;
   if (MathCeil(TFLarge/CurPeriod) != TFLarge/CurPeriod)
       TFLarge=MathCeil(TFLarge/CurPeriod)*CurPeriod;
   if (CurPeriod > TFSmall)
      {Alert ("The chart period must be less than or equal to ", TFSmall," min.");
       ErrorTF=1;return;}
   if (TFSmall >= TFMidle || TFMidle >= TFLarge || TFLarge>43200)
      {Alert ("Incorrect choice of timeframes for calulation!!!"); ErrorTF=1;return;}
   return;
}
//--------------------------------------------------------------------
The next block is responsible for the control points searching, ZigZag nodes calculation and writing them to the buffer arrays of the indicator.
The refusal of using the constructions of the int IC=IndicatorCounted(); type and so on depends on the calculation algorithm itself that provides the sufficient speed without it (see Force #1-3 in the code), it also can be increased, by the way, a bit sooner about it.
//--------------------------------------------------------------------
int start()
{
   if ( ErrorTF==1 ) return; // incorrect timeframe
   FractalCalc();
   return;
}
//======================================================================
// Searching of the 5 bar fractals and zigzag nodes claculation
// on the emulation of the larger TF, deleting of the odd ones and representation on the current TF
//======================================================================
void FractalCalc ()
{
   // Force  №1 - caculation only on the fully formed bar of the working TF
   if (PrevTimeCalc == Time[0]) return; else PrevTimeCalc=Time[0];
   int y, x, k, i, j, extr=0;
   // the time of the last bar of the current TF, that closes bar №1-5 of the larger TF
   int t1, t2, t3, t4, t5;
   // the number of the last bar of the cur. TF, that closes bar №1-5 of the larger TF
   int limit1, limit2, limit3, limit4, limit5;
   // the numver of bars of the cur. TF with the peaks and bases that correspond with the bars 1-5 of the larger TF
   int up1,up2,up3,up4,up5,dn1,dn2,dn3,dn4,dn5;

   for (y=1; y<=3; y++) // cycle of the calculated TF
      {
      if (y==1) Per=TFLarge; if (y==2) Per=TFMidle; if (y==3) Per=TFSmall;
      P60=Per*60;
      // Force №2 - calculate the fissures only with the forming of the bar of the larger TF
      if (PrevTimePer[y] !=0)
         {
         if (Per<43200 && (Time[0] - PrevTimePer[y])<P60 )continue;
         if (Per==43200 && Month()==TimeMonth(PrevTimePer[y]))continue;
         }
      // Processing of bars absence
      // If linearly PrevTimePer[y]=Time[0], then in case of bar absence
      // the shift of whole calculation chain by the absence size will take place on the working TF
      PrevTimePer[y]=MathCeil(Time[0]/Per/60)*P60;

      NumberExt=0;  extr=0;
      k=Per/CurPeriod;
      // limitation of cycle depending on currently calculated TF
      // and on the last fractal
      i=MathCeil(Bars/k)-5;
      // Force #3 - calculation starting with the last fissure
      if(y==1 && largelast !=0) i=largelast+k;
      if(y==2 && midlelast !=0) i=midlelast+k;
      if(y==3 && smalllast !=0) i=smalllast+k;
      for (x=1; x<=i; x++)
         {
         // find peaks and bases
         // the time of the beginning of the las bar of the cur. TF, that closes bar №1 of the larger TF
         if (PrevTimePer[y] !=0) t1=PrevTimePer[y]-x*P60+(k-1)*CP60;
         else t1=MathCeil(Time[0]/Per/60)*P60-x*P60+(k-1)*CP60;
         t2=t1-P60; t3=t2-P60; t4=t3-P60; t5=t4-P60;
         limit1=iBarShift(NULL,0,t1, false); limit2=iBarShift(NULL,0,t2, false);
         limit3=iBarShift(NULL,0,t3, false); limit4=iBarShift(NULL,0,t4, false);
         limit5=iBarShift(NULL,0,t5, false);
         up1=iHighest(NULL,0,MODE_HIGH,k,limit1); up2=iHighest(NULL,0,MODE_HIGH,k,limit2);
         up3=iHighest(NULL,0,MODE_HIGH,k,limit3); up4=iHighest(NULL,0,MODE_HIGH,k,limit4);
         up5=iHighest(NULL,0,MODE_HIGH,k,limit5);
         dn1=iLowest(NULL,0,MODE_LOW,k,limit1); dn2=iLowest(NULL,0,MODE_LOW,k,limit2);
         dn3=iLowest(NULL,0,MODE_LOW,k,limit3); dn4=iLowest(NULL,0,MODE_LOW,k,limit4);
         dn5=iLowest(NULL,0,MODE_LOW,k,limit5);

         // searching for control points
         if(High[up3]>High[up2] && High[up3]>High[up1] && High[up3]>=High[up4] && High[up3]>=High[up5])
            {
            if (y==1){Large[up3]=High[up3];largelast=up3;}
            if (y==2){Midle[up3]=High[up3];midlelast=up3;}
            if (y==3){Small[up3]=High[up3];smalllast=up3;}
            NumberExt++;  extr++;
            }
         if(Low[dn3]<Low[dn2] && Low[dn3]<Low[dn1] && Low[dn3]<=Low[dn4] && Low[dn3]<=Low[dn5])
            {
            if (y==1){Large[dn3]=Low[dn3];largelast=dn3;}
            if (y==2){Midle[dn3]=Low[dn3];midlelast=dn3;}
            if (y==3){Small[dn3]=Low[dn3];smalllast=dn3;}
            NumberExt++; extr++;
            }
         if (NumberExt>VolExt) break;
         }
      }
As you see, most of the code is aimed at the optimization of the calculations and the protection again a possible unexpected situation - lost server connection and lost bars in history.
The next block performs a kind of "weeding": the deletion of odd extremums (when several bases appear between two peaks, and vice versa) to form a correct ZigZag: the maximum/minimum ones are chosen from 2 or more peaks/bases coming in succession and, in the case of equality, the one with the least number is chosen... the odd ones are set to zero. The algorithm provides a room for argument, of course, and alternatives are possible, but I decided to do so for the moment.
The code contains commented entries that allow to get rid of disagreement in peaks/bases appearing on different TFs, but it is necessary to give it another brush, it doesn't work correctly in the present form. I held up on this idea temporarily, but you can do it yourselves if interested.
The same fragment has another possibility of speeding up its working if the construction if (NumberExt>VolExt) break; of the previously calculated shift is used, but I held it up, too, for the moment.
And, once we have started to talk about the speed, the most obvious and easiest method is to decrease the VolExt in the indicator's inputs; hardly anybody needs more than 10-15 ones for trading, not for analysis, except for real gourmands :).
   if (extr==0) return;
   for (y=1; y<=3; y++)
      {
      if (y==1) j=ArraySize(Large);if (y==2)j=ArraySize(Midle);
      if (y==3)j=ArraySize(Small);
      int min=0, max=0, extmin=0, extmax=0;
      NumberExt=0;
      for (x=1;x<=j;x++)
         {
         if (y==1)
            {
            if (Large[x] == 0.0 ) continue;
            if (Large[x] == High[x])
               {
               NumberExt++; extmax++; extmin=0;
               if (extmax==2)
                  {
                  if (Large[max]>=Large[x])Large[x]=0.0;
                  else {Large[max]=0.0;max=x;}
                  extmax--;
                  }
               else max=x;
               }
            if (Large[x] == Low[x])
               {
               NumberExt++; extmax=0; extmin++;
               if (extmin==2)
                  {
                  if (Large[min]<=Large[x])Large[x]=0.0;
                  else {Large[min]=0.0;min=x;}
                  extmin--;
                  }
               else min=x;
               }
            }
         if (y==2)
            {
            if (Midle[x] == 0.0 ) continue;
            if (Midle[x] == High[x])
               {
               NumberExt++; extmax++; extmin=0;
               if (extmax==2)
                  {
                  if (Midle[max]>=Midle[x])Midle[x]=0.0;
                  else {Midle[max]=0.0;max=x;}
                  extmax--;
                  // it can be easier as the above one, but.... remove disagreements
                  /*
                  if (Midle[max]>Midle[x])Midle[x]=0.0;
                  if (Midle[max]==Midle[x])
                     {
                     if (Large[x] == High[x]) {Midle[max]=0.0;max=x;}
                     else Midle[x]=0.0;
                     }
                  if (Midle[max]<Midle[x]){Midle[max]=0.0;max=x;}
                  */
                  }
               else max=x;
               }
            if (Midle[x] == Low[x])
               {
               NumberExt++; extmax=0; extmin++;
               if (extmin==2)
                  {
                  if (Midle[min]<=Midle[x])Midle[x]=0.0;
                  else {Midle[min]=0.0;min=x;}
                  extmin--;
                  // it can be easier as the above one, but.... remove disagreements
                  /*
                  if (Midle[min]<Midle[x])Midle[x]=0.0;
                  if (Midle[min]==Midle[x])
                     {
                     if (Large[x] == Low[x]) {Midle[min]=0.0;min=x;}
                     else Midle[x]=0.0;
                     }
                  if (Midle[min]>Midle[x]){Midle[min]=0.0;min=x;}
                  */
                  }
               else min=x;
               }
            }
         if (y==3)
            {
            if (Small[x] == 0.0 ) continue;
            if (Small[x] == High[x])
               {
               NumberExt++; extmax++; extmin=0;
               if (extmax==2)
                  {
                  if (Small[max]>=Small[x])Small[x]=0.0;
                  else {Small[max]=0.0;max=x;}
                  extmax--;
                  // it can be easier as the above one, but.... remove disagreements
                  /*
                  if (Small[max]>Small[x])Small[x]=0.0;
                  if (Small[max]==Small[x])
                     {
                     if (Midle[x] == High[x]) {Small[max]=0.0;max=x;}
                     else Small[x]=0.0;
                     }
                  if (Small[max]<Small[x]){Small[max]=0.0;max=x;}
                  */
                  }
               else max=x;
               }
            if (Small[x] == Low[x])
               {
               NumberExt++; extmax=0; extmin++;
               if (extmin==2)
                  {
                  if (Small[min]<=Small[x])Small[x]=0.0;
                  else {Small[min]=0.0;min=x;}
                  extmin--;
                  // it can be easier as the above one, but.... remove diagreements
                  /*
                  if (Small[min]<Small[x])Small[x]=0.0;
                  if (Small[min]==Small[x])
                     {
                     if (Midle[x] == Low[x]) {Small[min]=0.0;min=x;}
                     else Small[x]=0.0;
                     }
                  if (Small[min]>Small[x]){Small[min]=0.0;max=x;}
                  */
                  }
               else min=x;
               }
            }
         if (NumberExt>VolExt) break;
         }
      }

}
Conclusion
As a result, we've got an indicator with an algorithm that is perhaps obvious, but never used by anyone before, delivered from some disadvantages of standard ZigZag and owning the following advantages:
- nodes are redrawn relatively less frequently, the redrawing being reasonable for both the swing and the previous price movement. At the same time, if they coincide on different TFs, then it is 90-95% probable that no redrawing will occur;
- the possibility of observing everything that happens on three larger TF on a single chart, and, as a result, the possibility discover the main trends without using any additional constructions or tools;
- using for ZigZag calculations any substandard TFs (from M5 to MN1) meeting any taste and need;
- efficiency, high speed of calculations, clear algorithm and code that can be easily corrected and improved.
You may ask me why I shouldn't I do this correction myself and at once. It's enough for me what I've got for the moment.... enough FOR THE MOMENT. :)
And I know that a finished efficient code can be brushed infinitely. It is like whittling a pencil...you can forget that you wanted to draw with it. I would like to start drawing. I want it so much! :)
What will be the next and what should we do with it? There is no canned solution. This is only a tool, and what should be made using it, a Pinocchio or a stool, each Geppetto will decide for himself.
I can only say that the dry residual contains 5 free indicator buffers, the possibility of easy adding some new modules, and a quite adequate response to calling through iCustom().... Fantasize!
The nicest thing left is ACKNOWLEDGEMENTS to:
ANG3110 - for the most valuable thing - the ideas that, properly, pushed me to write this indicator;
Korey - for his support and help in the diagnstics of ТimeCurrent and calculations optimization;
Board people, who willy-nilly, consciously or not, but sometimes express their ideas that I want to think about.
Translated from Russian by MetaQuotes Ltd.
Original article: https://www.mql5.com/ru/articles/1531
Warning: All rights to these materials are reserved by MetaQuotes Ltd. Copying or reprinting of these materials in whole or in part is prohibited.
This article was written by a user of the site and reflects their personal views. MetaQuotes Ltd is not responsible for the accuracy of the information presented, nor for any consequences resulting from the use of the solutions, strategies or recommendations described.

 Integrating MetaTrader 4 Client Terminal with MS SQL Server
 Expert Advisors Based on Popular Trading Systems and Alchemy of Trading Robot Optimization (Part V)
 How to Become a Participant of Automated Trading Championship 2008?
 Comfortable Scalping
- Free trading apps
- Over 8,000 signals for copying
- Economic news for exploring financial markets
You agree to website policy and terms of use
thanks so much...am testing it n
what are the results???please post.