
How to Develop a Profitable Trading Strategy

Introduction
The process of developing successful trading strategies with implementation of technical analysis can be divided into several stages:
- Attach several technical indicators to a chart window of a financial instrument's price, and identify patterns of market correlations and signal indicators.
- Formulate data obtained from the previous correlation step.
- Convert strategy to a relevant programming language to create a mechanical trading system.
- Run the trading system through a simulator based on history data and try to match its input parameters (optimize).
- If the previous step hasn't increased the balance, proceed to step 1.
- Run the system obtained through the previous stages on demo accounts for testing.
- If the previous step hasn't brought any profit from virtual money, proceed to step 1.
- Use the system in real-life trading, occasionally adjusting its input parameters to the changing market conditions.
Let's see what happens, if we try to computerize the whole process.
This article analyzes the use of a simple single-layer neural network for identifying the future price movements based on the readings of the Acceleration/Deceleration (AC) Oscillator.
Neural Network
where:
wi - weighting coefficient with index i,
ai - numerical value of a sign with object's index i,
d - threshold value that often equals 0.
If the left side of the inequation appears to be higher than the threshold value, then the object belongs to a specific class, if it is lower, the same does not apply. In case when the object classification implies a separation into two classes, a single-layer neural network is sufficient.
It may seem that the inequation used in a neural network is somehow similar to a "shamanic spell" in regards to weighting factors. In reality, this is not the case. The principle of neural network operation has a geometric meaning.
In fact, a plane is described geometrically as a linear equation. For example, in a three-dimensional space the plane equation concerning the coordinates X, Y and Z is the following:
The coordinates of all points located on one side of the plane in this space satisfy the inequation:
And coordinates of all points positioned on the other side of the plane satisfy the inequation:
Thus, if a plane equation and any points coordinates are known to us, we can divide a set of all points in space into two sets of points separated by this plane.
Respectively, weighting coefficients in a neural network inequation are constants that define a certain plane equation in the multidimensional space of objects' signs. By means of inequation we can accurately determine, whether these objects lie on one or the other side of the specified plane. For this purpose it is sufficient to locate the objects' coordinates and, by substituting them in the equation of the plane, compare with zero.
Problem Definition
However, there is one issue with neural networks. Let's take a two-dimensional space of signs described by coordinates X and Y. We will use this space to place objects with coordinates of points.
The figure above shows that if a set of points in red color do not intersect a set of coordinate points marked blue, then both sets can be separated using lines (a line is a separator in two-dimensional space, and a plane - in three or more dimensional space). Please note that the equations for these dividing lines may vary. Another example now:
We can see that the sets of points are intersected in space and it isn't possible to draw a clear dividing line between them. The only viable solution would be to draw a line that would separate two sets of points, so that the majority of red objects stay on one side, and the blue objects - on the other side. This time, we are dealing with an optimization issue, i.e. a search for an equation dividing a plane or line, able to have a maximum separation between two objects' classes, but with probability that some points' membership to a class will be mistakenly identified as a membership to another class.
There are other ways to implement neural networks, namely, via nonlinear filters and multilayer networks. Nonlinear filters allow using a higher-order dividing surface as a boundary layer separation between objects of different classes. Multilayer networks imply using multiple filters (separating planes or surfaces) for identifying objects that belong to three or more classes.
Let's try to define a problem that we will have to solve. Basic information a trader should know to achieve profitable trading results is a direction of the price changes. If a price goes up, a trader should open a long position. If it goes down, a trader should open a short position. Therefore, we already have two classes of objects, namely, the directions of price movements. In order to make a decision, following the technical analysis, traders refer to a study of the so-called technical indicators and oscillators. We will also analyze the oscillator named AC.
Since technical oscillators are histograms whose values deviate from a horizontal line, then, respectively, we will require a neural network with a line filter. We will be using patterns as signs of an object, i.e. the oscillator's values at four points taken in seven period steps back in history, starting from the current moment.
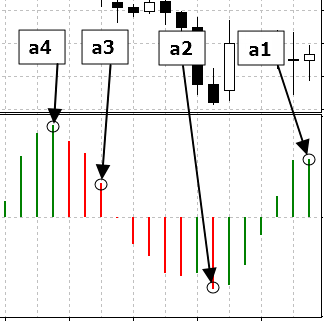
The value of the oscillator is marked with a circle in the figure above. We will identify them as a1, a2, a3 and a4, and put in the separation plane's equation to compare the obtained value with zero in order to find out from which side the pattern will show.
It only remains now to get the plane equation, which will separate the patterns preceding upward price movement from the patterns preceding downward price movement.
For this purpose we will use the genetic algorithm built in MetaTrader 4 and intended for speeding up the optimization processes. In other words, we will select the values of linear filter weighting coefficients in a such way, that consequently will allow us to obtain the dividing line equation for the maximum balance, using the optimization strategies based on history data.
For this purpose we need, at least, a formulation of the trading strategy, in order to implement the algorithm and to convert it to the Expert Advisor code for MetaTrader 4.
In theory, a trading system should provide signals for both market entry and exit. However, the output signals are optional and can be avoided under the following conditions:
- Placing take profit and stop loss orders;
- Turning in the opposite direction upon a receipt of a signal indicating a change of direction in the market trend.
- Prices are likely to move upwards;
- Prices are likely to move downwards.
To reduce the number of false neural network signals, we will read and make decisions based only on formed bars and opening prices of the same bars.
Problem Solution
Please find below the source code of the Expert Advisor implementing this trading strategy://+------------------------------------------------------------------+ //| ArtificialIntelligence.mq4 | //| Copyright й 2006, Yury V. Reshetov | //| http://reshetov.xnet.uz/ | //+------------------------------------------------------------------+ #property copyright "Copyright й 2006, Yury V. Reshetov ICQ:282715499 http://reshetov.xnet.uz/" #property link "http://reshetov.xnet.uz/" //---- input parameters extern int x1 = 120; extern int x2 = 172; extern int x3 = 39; extern int x4 = 172; // StopLoss level extern double sl = 50; extern double lots = 0.1; extern int MagicNumber = 888; static int prevtime = 0; static int spread = 3; //+------------------------------------------------------------------+ //| expert initialization function | //+------------------------------------------------------------------+ int init() { //---- return(0); } //+------------------------------------------------------------------+ //| expert deinitialization function | //+------------------------------------------------------------------+ int deinit() { //---- return(0); } //+------------------------------------------------------------------+ //| expert start function | //+------------------------------------------------------------------+ int start() { if(Time[0] == prevtime) return(0); prevtime = Time[0]; //---- if(IsTradeAllowed()) { spread = MarketInfo(Symbol(), MODE_SPREAD); } else { prevtime = Time[1]; return(0); } int ticket = -1; // check for opened position int total = OrdersTotal(); for(int i = 0; i < total; i++) { OrderSelect(i, SELECT_BY_POS, MODE_TRADES); // check for symbol & magic number if(OrderSymbol() == Symbol() && OrderMagicNumber() == MagicNumber) { int prevticket = OrderTicket(); // long position is opened if(OrderType() == OP_BUY) { // check profit if(Bid > (OrderStopLoss() + (sl * 2 + spread) * Point)) { if(perceptron() < 0) { // reverse ticket = OrderSend(Symbol(), OP_SELL, lots * 2, Bid, 3, Ask + sl * Point, 0, "AI", MagicNumber, 0, Red); Sleep(30000); if(ticket < 0) { prevtime = Time[1]; } else { OrderCloseBy(ticket, prevticket, Blue); } } else { // trailing stop if(!OrderModify(OrderTicket(), OrderOpenPrice(), Bid - sl * Point, 0, 0, Blue)) { Sleep(30000); prevtime = Time[1]; } } } // short position is opened } else { // check profit if(Ask < (OrderStopLoss() - (sl * 2 + spread) * Point)) { if(perceptron() > 0) { // reverse ticket = OrderSend(Symbol(), OP_BUY, lots * 2, Ask, 3, Bid - sl * Point, 0, "AI", MagicNumber, 0, Blue); Sleep(30000); if(ticket < 0) { prevtime = Time[1]; } else { OrderCloseBy(ticket, prevticket, Blue); } } else { // trailing stop if(!OrderModify(OrderTicket(), OrderOpenPrice(), Ask + sl * Point, 0, 0, Blue)) { Sleep(30000); prevtime = Time[1]; } } } } // exit return(0); } } // check for long or short position possibility if(perceptron() > 0) { //long ticket = OrderSend(Symbol(), OP_BUY, lots, Ask, 3, Bid - sl * Point, 0, "AI", MagicNumber, 0, Blue); if(ticket < 0) { Sleep(30000); prevtime = Time[1]; } } else { // short ticket = OrderSend(Symbol(), OP_SELL, lots, Bid, 3, Ask + sl * Point, 0, "AI", MagicNumber, 0, Red); if(ticket < 0) { Sleep(30000); prevtime = Time[1]; } } //--- exit return(0); } //+------------------------------------------------------------------+ //| The PERCEPRRON - a perceiving and recognizing function | //+------------------------------------------------------------------+ double perceptron() { double w1 = x1 - 100.0; double w2 = x2 - 100.0; double w3 = x3 - 100.0; double w4 = x4 - 100.0; double a1 = iAC(Symbol(), 0, 0); double a2 = iAC(Symbol(), 0, 7); double a3 = iAC(Symbol(), 0, 14); double a4 = iAC(Symbol(), 0, 21); return (w1 * a1 + w2 * a2 + w3 * a3 + w4 * a4); } //+------------------------------------------------------------------+
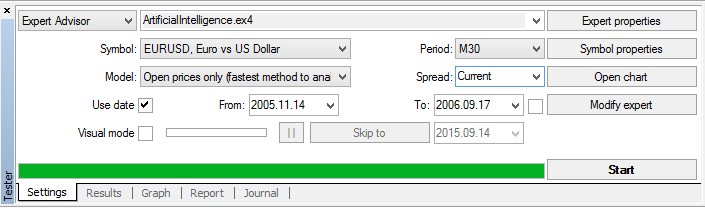
Now we simply have to select the weighting coefficients of the parting plane linear equation for a neural network. Let's run a strategy tester by pressing the keys Ctrl + R:
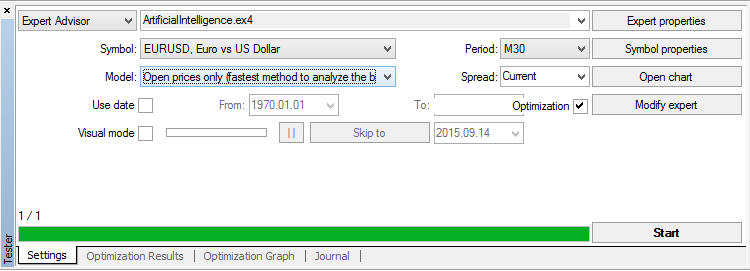
In Settings tab we select a fast method emulation market model only for opening prices (signals in our EA are read based on the formed bars). We tick the Recalculate and Optimization, and then click Expert properties.
Testing tab:
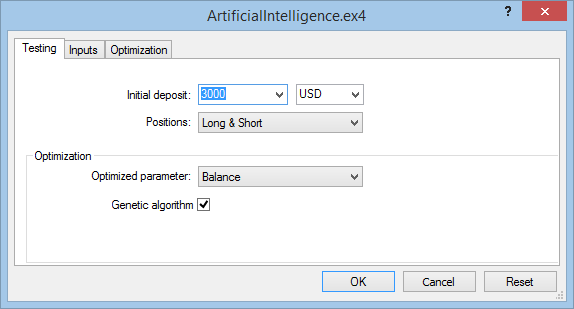
We choose the initial deposit of $3,000, the optimization and testing will be carried out based on long and short positions. The main optimization index will be considered as the maximum balance during the test period. Also, a genetic algorithm should be included in order to speed up the optimization process.
Inputs tab:

We will tick the input parameters selected by a genetic algorithm: x1, x2, x3 and x4 for the neural network weighting factors, also we will need to choose the acceptable value sl - stop loss level. Number of lots will be taken as 1 and a magic number will remain by default.
Optimization tab:
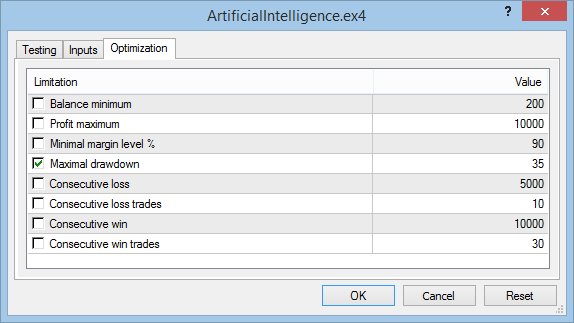
To speed up the optimization process, the maximum drawdown will be set up at the level of 35%. To clarify the acceptable level of a maximum drawdown it is necessary, first, to start the optimization process without any restrictions. Only after the first optimization results are obtained, it is required to take its value, round it up, and, after stopping the process, to enter the trading limits. The restarted optimization process will run considerably faster.
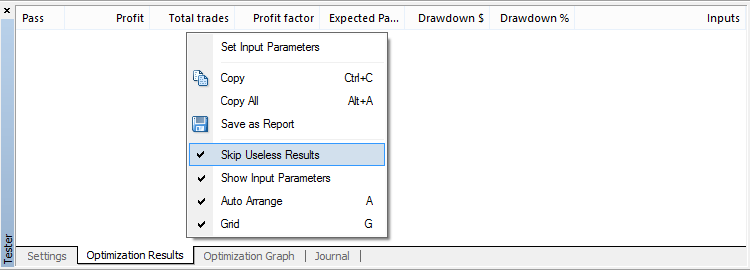
Click OK to close the Expert settings tab. Now we can start the optimization process by pressing the Start button. It is also advisable to disable the output for useless results:
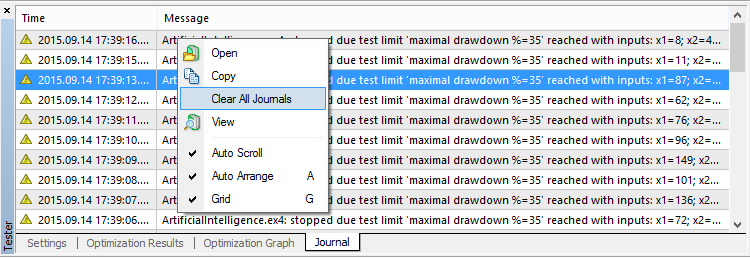
During the process of optimization it is advisable to clear all journals occasionally, if a computer is weak and has a small RAM.
On Pentium III the entire optimization process takes slightly over an hour. The time depends on the financial instrument.
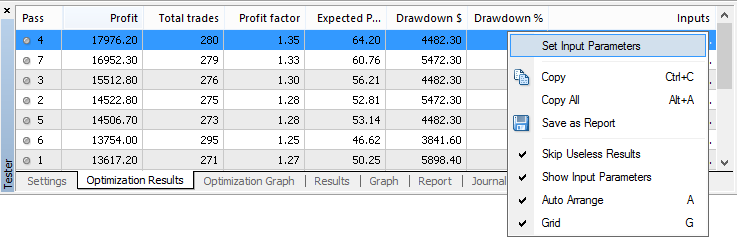
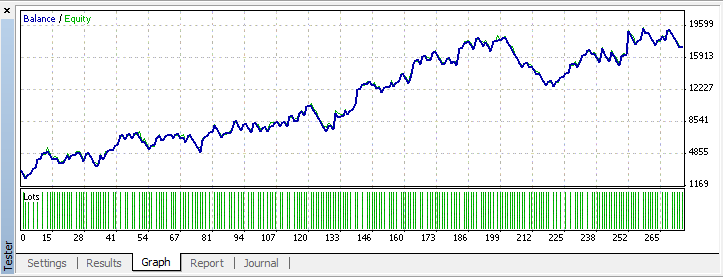
All is left to do is to click the right button located on the top line and, by selecting Set Input Parameters from the pop-up menu, begin testing on history data.
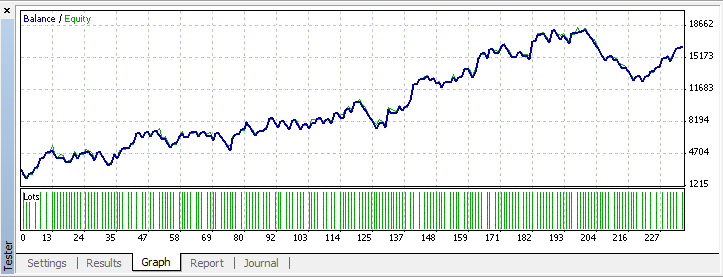
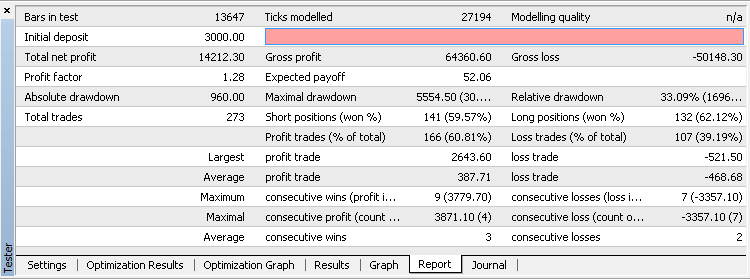
There is no doubt, that the test results will match data issued by the optimizer.
We would like to publish these results here. However, anyone in doubt can make a claim, that the information could be simply tailored to the history data. And how will the obtained strategy behave in case of the market change? How relevant are the patterns obtained for the last periods in the future? Take, for example, the participation in the automated trading championship, where rules prohibit to make any amendments to the input parameters until the championship is over.
Let's try and make an experiment. To do this, the neural network will be trained on history data, taken as a representative sample, but will exclude the past three months data. For this purpose we will use a limitation of optimization period and testing by dates functions integrated in the tester.
Let's start the process of optimization. We will obtain the results for the input parameters: x1 = 146, x2 = 25, x3 = 154, x4 = 121, sl = 45.

Conclusion
How shall we treat the conclusions regarding neural networks made by D. Katz and D. McCormick in their book "The Encyclopedia of Trading Strategies"?Firstly, operate by following the principle: trust, but verify. The so-called activities of D. Katz and D. McCormick are built in a way to avoid the possibility of this test. In other words, this is an unscientific approach that excludes reproduction. It is understandable when some people are involved in publishing business, rather than trading. Their task is to successfully sell the manuscript, without depending much on its content. To make sense out of this, it is sufficient to understand, what path they were going to create all the scrap paper written in style "500 useless advice" interspersed with figures. Let's try to sort things out.
- The problem definition by D. Katz and D. McCormick was to create a non-existent indicator or, to be more precise, a time-reversed slow %K stochastic, which, in fact, acts as a time machine and takes information from 10 bars ahead and based on it provides readings for 10 bars all the way backwards. If I had this indicator, Bill Gates and George Soros would be highly unlikely to compete with me;
- The next step was to take some data and using the telepathic abilities to obtain the stochastic predictions. They have already set the approximation task, that is, knowing the function arguments, to obtain its value. Approximation is, in fact, the adaptation, which Katz and McCormick so pointedly argue on the pages of their manuscript;
- It does not matter as much how the approximation was obtained, as it is more important that neural networks are not suitable for this goal. It would be much easier to complete the same task, for example, through a spectral analysis;
- Neural networks are acting even worse with interpolation and extrapolation tasks, and if we take data from a representative sample, then the extrapolation, rather than a membership to a certain class, applies;
- Having some kind of telepathic stochastic approximation which realization included obvious errors, Katz and McCormick went further and based on the readings of this erroneous device created a "trading strategy", which also had to interpret the readings of a faulty device, namely, if %K surpasses certain limits, then it is likely that the prices have reached maximum or minimum values. After all this "tinsel" was stuck in a mechanical trading system and, having received its statistics and hasty conclusions, the authors proposed to introduce them to their readers.
However, it wasn't just Katz and McCormick who failed the experiments linked to neural networks. The first neural network project called "Perceptron" also did not justify hopes that were pinned on it. It is the first step that costs troublesome, which is exactly what happened with Frankenstein. Later objective analysis about the capabilities and disabilities of a neural network, was conducted by M. Minsky and S. Papert [1]. Therefore, before proceeding to finding a solution for certain problems with neural networks, try not to step on the same rake twice:
- The problem definition should not contain telepathic future projections in order to get a precise answer to the question of when and how much. The solution should be restricted to the form of a decision identification based on the current signs in a form of separation into few exclusive potential situations. For example, if you have a weather related task, do not try to find out when exactly it will start raining, or what will be the amount of rainfall in millimeters. Limit the forecast of a potential situation to a change towards a sunny or a rainy weather;
- Cut all the unnecessary with "Occam's Razor". Some experimentators believe that the more layers the neural network has and the more complex its activation functions are, the better results turn out to be. This way you can certainly draw a more accurate line separating the identified objects based on their features. No one will dispute that. But why? After all, such approach is equivalent to building sand castles. If the border had a defined shape, that remained constant in time and independent from other circumstances, then the complexity to maximize a refinement would have a meaning. But most problems solved with the assistance of neural networks cannot be applied to this category. Financial instruments also do not stand still. Therefore, the simplest neural network with a low number of inputs and a single layer, may be more acceptable than a more complex construction with a disposable efficiency.
References
- Minsky, M. and Papert, S. (1969) PERCEPTRON; an Introduction to Computational Geometry, MIT Press, Massachussetts
Translated from Russian by MetaQuotes Ltd.
Original article: https://www.mql5.com/ru/articles/1447
Warning: All rights to these materials are reserved by MetaQuotes Ltd. Copying or reprinting of these materials in whole or in part is prohibited.
This article was written by a user of the site and reflects their personal views. MetaQuotes Ltd is not responsible for the accuracy of the information presented, nor for any consequences resulting from the use of the solutions, strategies or recommendations described.

- Free trading apps
- Over 8,000 signals for copying
- Economic news for exploring financial markets
You agree to website policy and terms of use
great great great article
Yury is pure master
i'm running optmization base on the code.
well, it is profitable.
hi can you share what did you do, parameters, etc? im getting different results. Would really appreciate it
Thank you!
Não sei porque, mas não consigo reproduzir os mesmos resultados. Os dados históricos do MetaQuote foram usados para este backtest. Alguma ideia do que estou fazendo errado?
this type of chart occurs when you are using a very short stop, note that in some cases when you must multiply the stop by 10, 50 pips = 500 points. this should solve your problem.