
Displaying of Support/Resistance Levels
Introduction
The article deals with detecting and indicating Support/Resistance Levels in the
MetaTrader 4 program. Based on a simple algorithm, the convenient and universal
indicator FindLevels creates horizontal support lines in the symbol chart. You
can see it below:
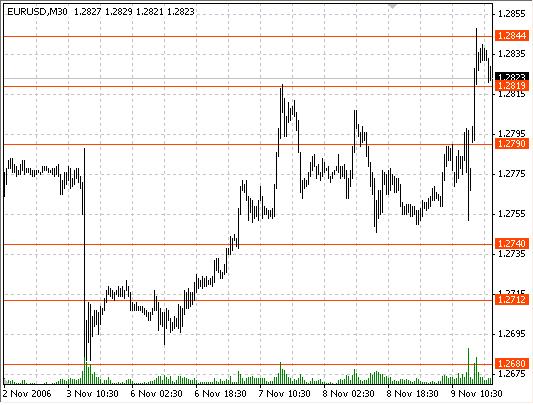
The article also tackles the useful theme of creating a simple indicator that can
display the results of different timeframes in one wrokspace. You can see an example
below.

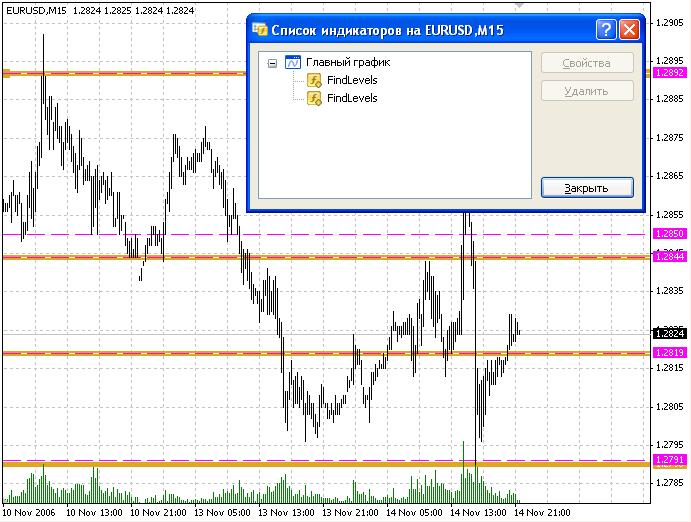
The first indicator displays support levels (thick beige lines) based on 30-minute quotes. The second indicator
running in the same window displays the levels based on 15-minute timeframe (thin dashed purple lines) above
the 30-minute levels. See the “Indicators Interaction” section for more details.
This present article is a sequel of the article about creating a script for detecting support levels, but the difference between them is that this article has been written for those who find themselves at the advanced level in programming and using the MetaTrader 4 platform. That is why my recommendation to the beginners and all those who find this article too complicated is to start with my previous article named A Method of Drawing the Support/Resistance Levels.
Theoretical Review
Let us describe the algorithm for detecting support/resistance levels, which will be further realized in the FindLevels indicator. A support/resistance level is a price value that cannot be crossed due to some forces. It can be the forces induced by psychological mark, the influence of some big players or a big amount of StopLoss orders in this area. It is obvious that the quotes will cross this line far less frequently than the other lines which are not support ones. You can find the evidence of this fact in many trading books.
To take advantage of this fact we have to calculate the quantity of the bars that cross each price. This is a result of the calculations described in the previous article:
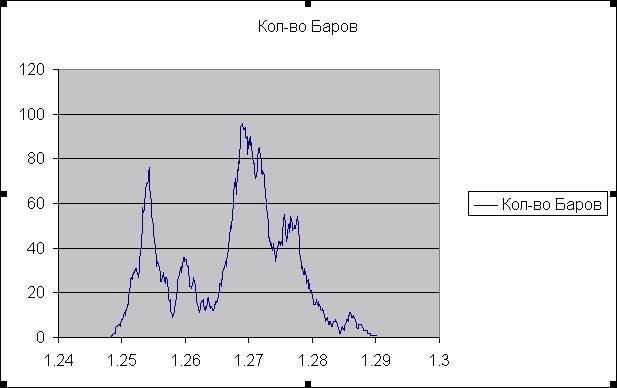
The horizontal axis in this picture is a price; the vertical axis marks the quantity of the bars crossing the price. The chart has a lot of local minimums as you can see in the picture. A local minimum is a point that belongs to a non-zero interval and itself is the minimum of this interval. Now we have to select the local minimums according to a certain characteristic.
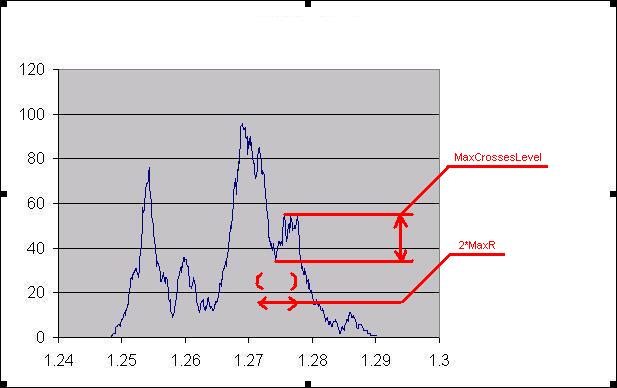
First, we will set a constant, MaxR, which is the area radius. If a local minimum
is not the minimum that belongs to the MaxR radius area, then it does not suit
our task. Second, we will set MaxCrossesLevel parameter. If the maximum of function
differs from the minimum less than by the MaxCrossesLevel in the MaxR area, we
will not display this local minimum, as it is not significant enough. This is the
mechanism of detecting support/resistance levels. Following this simple algorithm,
we will write the indicator.
Auxiliary Functions
As it was described above, the FindLevels indicator is designed for working with quotes from any timeframe. The timeframe is set by the user (TimePeriod variable). For the sake of simplicity of the code, we will set two easy functions that do not require additional explanations:
double prLow(int i)
  {
    return (iLow(NULL,TimePeriod,i));
  }

double prHigh(int i)
  {
    return (iHigh(NULL,TimePeriod,i));
  }
The third and the fourth functions are necessary for the convenient displaying of the support levels, their width, color and the indication mode that will depend on the timeframe:
int Period2Int(int TmPeriod)
  {
    switch(TmPeriod)
      {
        case PERIOD_M1  : return(0);
        case PERIOD_M5  : return(1);
        case PERIOD_M15 : return(2);
        case PERIOD_M30 : return(3);
        case PERIOD_H1  : return(4);
        case PERIOD_H4  : return(5);
        case PERIOD_D1  : return(6);
        case PERIOD_W1  : return(7);
        case PERIOD_MN1 : return(8);
      }
    return (0);
  }

string Period2AlpthabetString(int TmPeriod)
  {
    return(Alphabet[Period2Int(TmPeriod)]);
  }
The sense of setting the function Period2AlphabetString() is described in the “Indicators Interaction" section, and the use of Period2Int() function will be clear from the next section.
Writing the Indicator
Let us start with the external variables, which are set by the user:
extern int MaxLimit = 1000;
extern int MaxCrossesLevel = 10;
extern double MaxR = 0.001;
extern int TimePeriod = 0;
extern color LineColor = White;
extern int LineWidth = 0;
extern int LineStyle = 0;
- MaxLimit - the amount of historical bars in use;
- MaxCrossesLevel – the minimal difference between the local maximum and the local minimum (see the detailed description in the "Theoretical Review” section;
- MaxR – the radius of the area where the minimum is detected;
- TimePeriod – the timeframe for detecting the support levels. By default, it is the timeframe of the mapping window;
- LineColor – the color of the displayed lines;
- LineWidth – the line width, 0 by default;
- LineStyle – the line style, 0 by default.
If the LineColor, LineWidth or LineStyle values are set by the user as by default,
while performing the Init procedure we will change them into the other ones that
will depend on the timeframe. Then the view of the lines from different timeframes
will not be identical and we will be able differentiate them easily.
int init()
  {
    if(TimePeriod == 0)
        TimePeriod = Period();

    if(TimePeriod != 0 && LineWidth == 0)
        if(Period2Int(TimePeriod) - Period2Int(Period()) >= 0)
            LineWidth = Widths[Period2Int(TimePeriod) - Period2Int(Period())];
        else
          {
            LineWidth = 0;
            if(LineStyle == 0)
                LineStyle = STYLE_DASH;
          }

    if(TimePeriod != 0 && LineColor == White)
        LineColor = Colors[Period2Int(TimePeriod)];

    return(0);
  }
In the first line we set the TimePeriod value if it has been set by default. Then we determine the line width. The more the TimePeriod value in relation to the timeframe of the chart (mapping window) is, the wider are the lines. If the TimePeriod is less than the chart period, the line width is equal to 0 and the line is dashed. Each time period has its own color.
The arrays Colors[] and Width[] are defined in the following way:
color  Colors[] = {Red,Maroon, Sienna, OrangeRed, Purple,I ndigo,
                   DarkViolet, MediumBlue, DarkSlateGray};
int    Widths[] = {1, 2, 3, 4, 5, 6, 7, 8, 9};
Let us define the remaining variables:
int CrossBarsNum[];
bool CrossBarsMin[];
double d1Num = 0.0, d2Num = 0.0;
datetime TMaxI = 0;
- The array CrossBarsNum[] – the array indicating the amount of bars for each price;
- CrossBarsMin[] – the array corresponding to the fact whether the line with the set price is a local minimum or not;
- d1Num and d2Num - the minimum and the maximum prices which belong to the bar interval from 0 to MaxLimit;
- TMaxI – indicating the time of the last processed bar.
#define MaxLines 1000
string LineName[MaxLines];
int LineIndex = 0;
MaxLines -the maximum amount of the lines which you will create;
LineName[] – the array of their names;
LineIndex – the index of the empty cell in the array LineName[].
Let us pass on the function start():
int counted_bars = IndicatorCounted();
int limit = MathMin(Bars - counted_bars, MaxLimit);

double d1 = prLow(iLowest(NULL, TimePeriod, MODE_LOW, limit, 0));
double d2 = prHigh(iHighest(NULL, TimePeriod, MODE_HIGH, limit, 0));
We calculate the limit variable using the quantity of the bars that has not been changed since the last fetch of the indicator. d1 and d2 are the minimum and the maximum of the price at the interval from 0 to limit.
if(d1Num != d1 || d2Num != d2)
  {
    ArrayResize(CrossBarsNum, (d2 - d1)*10000);
    ArrayResize(CrossBarsMin, (d2 - d1)*10000);

    if(d1Num != d1 && d1Num != 0.0)
      {
        ArrayCopy(CrossBarsNum, CrossBarsNum, 0, (d1Num - d1)*10000);
        ArrayCopy(CrossBarsMin, CrossBarsMin, 0, (d1Num - d1)*10000);
      }

    d1Num = d1;
    d2Num = d2;
  }
During the indicator operation, the price gaps covered with the CrossBarsNum[] and
CrossBarsMin[] arrays can change. Every time when it happens we have to increase
the quantity of the cells in the array and to move it to the right if necessary.
It usually happens if the new variables d1, d2 do not match the variables d1Num,
d2Num which have been gotten at the previous launch of the function start().
for(double d = d1; d <= d2; d += 0.0001)
  {
    int di = (d - d1)*10000;
    for(int i = 1; i < limit; i++)
        if(d > prLow(i) && d < prHigh(i))
            CrossBarsNum[di]++;
    if(Time[limit] != TMaxI&&TMaxI != 0)
        if(d > prLow(iBarShift(NULL, 0, TMaxI)) &&
           d < prHigh(iBarShift(NULL, 0, TMaxI)))
            CrossBarsNum[di]--;
  }
TMaxI = Time[limit] - 1;
After we have made sure that our arrays fit the necessary dimensions, we start to
calculate the new bars for each price and to increase the CrossBarsNum[] value
when the bar crosses the price level. As the news bars are constantly emerging,
the old bars will be excluded from the [0 : limit] interval. For this reason we
have to check such kind of bars and to decrease the CrossBarsNum[] value in case
of intersection. Then we will assign the time of the last calculated bar to the
TmaxI variable.
double l = MaxR*10000;
for(d = d1 + MaxR; d <= d2 - MaxR; d += 0.0001)
  {
    di = (d - d1)*10000;
    if(!CrossBarsMin[di] && CrossBarsNum[ArrayMaximum(CrossBarsNum, 2*l, di - l)] -
       CrossBarsNum[ArrayMinimum(CrossBarsNum, 2*l, di - l)] > MaxCrossesLevel &&
       CrossBarsNum[di] == CrossBarsNum[ArrayMinimum(CrossBarsNum, 2*l, di - l)] &&
       CrossBarsNum[di-1] != CrossBarsNum[ArrayMinimum(CrossBarsNum, 2*l, di - l)])
      {
        CrossBarsMin[di] = true;
        LineName[LineIndex] = Period2AlpthabetString(TimePeriod) + TimePeriod + "_" + d;
        ObjectCreate(LineName[LineIndex], OBJ_HLINE, 0, 0, d);
        ObjectSet(LineName[LineIndex], OBJPROP_COLOR, LineColor);
        ObjectSet(LineName[LineIndex], OBJPROP_WIDTH, LineWidth);
        ObjectSet(LineName[LineIndex], OBJPROP_STYLE, LineStyle);
        LineIndex++;
      }
    if(CrossBarsMin[di] && CrossBarsNum[di] !=
       CrossBarsNum[ArrayMinimum(CrossBarsNum, 2*l, di - l)])
      {
        CrossBarsMin[di] = false;
        ObjectDelete(Period2AlpthabetString(TimePeriod) + TimePeriod + "_" + d);
      }
  }
At the end of the start() procedure we monitor the CrossBarsMin[] array once again in order to determine the new local minimums and to delete the old ones which turn out not to be the local minimums anymore. As it is more than one local minimum possible (there are several matching values in the CrossBarsMin[] array and they all are the local minimums), we have to derive only one of them. We will use the local minimum with the lowest price.
CrossBarsNum[di] == CrossBarsNum[ArrayMinimum(CrossBarsNum, 2*l, di - l)] &&
CrossBarsNum[di-1]!= CrossBarsNum[ArrayMinimum(CrossBarsNum, 2*l, di - l)]
There is nothing complicated in creating a new graphical object –horizontal line. We set the features for this line: the width, the style, the color, that have been designed previously in the Init procedure. There is nothing complicated in deleting the levels which turn out not to be support levels anymore. There is one thing that is not clear: why and for what purpose we use the Period2AlpthabetString(TimePeriod) function in the name of the object. The next paragraph describes this issue, which has been several times mentioned before.
Indicators Interaction
As it was mentioned at the beginning of the article, the FindLevels indicator is designed for indicating the support levels of several timeframes in the one chart. In order to achieve this we need the following things:
It should be possible to launch the indicator several times and the indicator should have the input data with the time period;
The lines should be different and we should easily define what time period each support level belongs to;
All the lines should be traced both from long and short period of time.
The first point doesn’t cause any problems. We have no global variables. There are different names of graphical objects for each time period, as we have the period in the name of the object, (e.g. “f30_1.25600000”, 30 is the time period), and so there will be no conflicts when we launch the several indicators.
The second point is realized successfully, as each line has its color depending on the period (LineColor=Colors[Period2Int(TimePeriod)]).
Now we have the third point left. It is quite logical that if a line turns out to be the support line for 5-minutes chart, it will be also the support line for 30-minutes chart. If these lines clash in price and have the same width, we will just not see one of the lines! That is why the lines of different timeframes should differ in width. We will make the support levels of the longer timeframes wider than the lines of the shorter ones. It is quite reasonable, because the lines belonging to the long intervals are more significant.
We have to set the proper priority of displaying the lines. The thinner lines should be displayed at the end and should overlay the thick lines, so that they can be seen clearly. In the MetaTrader 4 program the objects are displayed in alphabetical order. So it is necessary that the names of the lines of the longer periods should alphabetically come prior to the lines of the shorter periods. That is why we have created the function which sets the Latin alphabet letter depending on the period:
string Period2AlpthabetString(int TmPeriod)
  {
    return (Alphabet[Period2Int(TmPeriod)]);
  }
Alphabet is the array of the Latin letters in reverse order. The full name of each support level is the following: Period2AlpthabetString(TimePeriod)+TimePeriod+"_"+d.
For better understanding let me refer to the screenshot from the beginning of the article:
Summary
The testing of the indicator showed that it works fine. It is easy to use because
it can display the data from the different timeframes. The testing period showed
that it is more convenient if the indicator displays 3-10 support levels for each
TimePeriod. To achieve this, we have to select the corresponding input entries
MaxR and MaxCrossesLevel. During the testing MaxR varied from 0.0003 for shorter
timeframes to 0.002 for longer ones. MaxCrossesLevel varied from 3 to 20. Perhaps
it would be helpful to configure the indicator so that it could display the certain
amount of the most significant support levels, but if so, it would have made the
code more complicated. I think those who like my indicator can easily do it themselves.
Translated from Russian by MetaQuotes Ltd.
Original article: https://www.mql5.com/ru/articles/1440
Warning: All rights to these materials are reserved by MetaQuotes Ltd. Copying or reprinting of these materials in whole or in part is prohibited.
This article was written by a user of the site and reflects their personal views. MetaQuotes Ltd is not responsible for the accuracy of the information presented, nor for any consequences resulting from the use of the solutions, strategies or recommendations described.

 A Method of Drawing the Support/Resistance Levels
 Simultaneous Displaying of the Signals of Several Indicators from the Four Timeframes
 Genetic Algorithms vs. Simple Search in the MetaTrader 4 Optimizer
- Free trading apps
- Over 8,000 signals for copying
- Economic news for exploring financial markets
You agree to website policy and terms of use
I have analyzed the code and found problems. In no particular order:
if(d1Num != d1 && d1Num != 0.0){
        ArrayCopy(CrossBarsNum, CrossBarsNum, 0, (d1Num - d1)*10000);
The code assumes 4 digits, would be extremely slow on they Yen. I don't think that the copy moves counts in the correct direction (up or down is possible. )So I rewrote the code but kept the same functionality.
The original code took about ten seconds to refresh. My code is instantaneous.
I didn't like the MaxCrossesLevel and MaxR idea. For one it doesn't show the min/max lines because of long tails. I replaced that portion with different algorithm.
Code was lost over the last 8 years. I've attached what I believe was the modified file.
Code was lost over the last 8 years. I've attached what I believe was the modified file.
Good morning from Turkey. Good morning from Turkey. Thank yo very much for this usefull code.
The attached file works fine, except the lower horizontal line dissapers and not seen again after the backtest starts. I checked the code several times, still I didnt get why it happens. I gave my own inputs; 100,1,0.01,Yellow,0,3,5. Do I miss something about this code? Or is there something really wrong and I cant catch it?
Code was lost over the last 8 years. I've attached what I believe was the modified file.
Good day! Thank yo very much for your work!
The attached file does not work and I cannot understand what the problem is, could you tell me what needs to be fixed to make this indicator work? Thank you for your help.