
A Method of Drawing the Support/Resistance Levels
Introduction
The support/resistance levels are the basic tool used by almost all traders. These levels can be found in most of the forecasts, and every trader must be able to detect them independently.
This article describes the process of creating a simple script for detecting the
support/resistance levels. It is written for beginners and you can find the detailed
explanation of every stage of the process. However, though the script is very simple,
the article will also be useful for advanced traders and users of the MetaTrader
4 platform. It contains the examples of the data export into the tabular format,
the import of the table to Microsoft Excel and plotting the charts for the further
detailed analysis.
Support/Resistance Levels
You can see below the two support/resistance levels.
You can find the evidence in the picture below.
The calculations are not very difficult. As a result, we have a correlation between each price and the number
of bars that have crossed this price. Now we have the problem of displaying the results. It is not possible to
make it in MetaTrader using the indicator chart, because we don’t need a price chart on time, but a bar chart
on price. That is why we need to export the data and to analyze them in some different program.
Creating a Script
First, we have to create a new script.
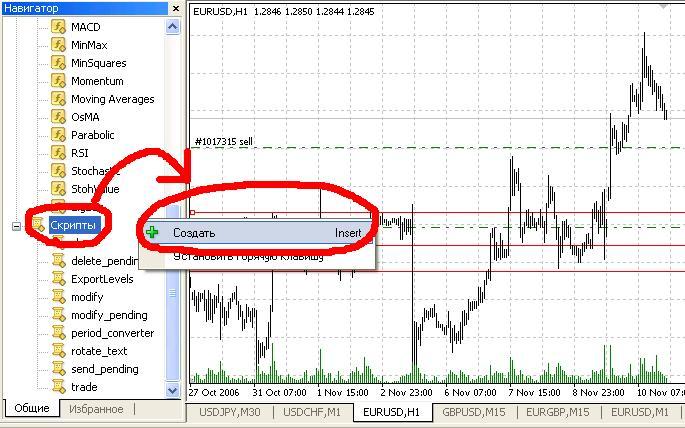
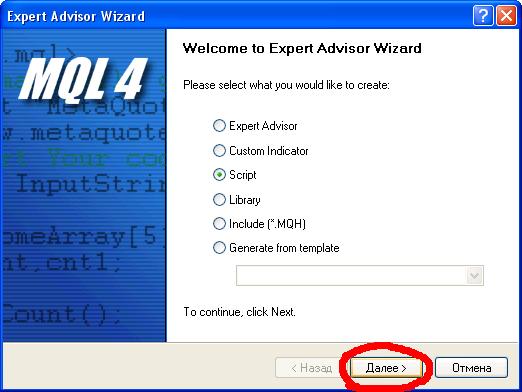
To perform this, let us go to the “Navigator” window and then right-click the “Scripts” section and select the "Create" command. A new window will appear. Make sure that the type of the program you are going to create is the script and then click the “Next" button.
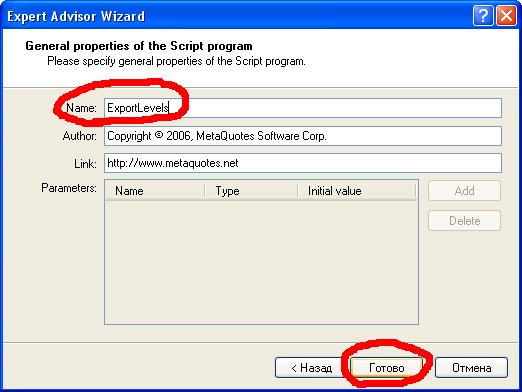
Then you will be asked to enter the script name and parameters. After clicking the”Done” button, you can start writing the script.
Writing the Script
The source code of the script does not contain more than twenty lines:
//+------------------------------------------------------------------+
//|                                                 ExportLevels.mq4 |
//|                      Copyright © 2006, MetaQuotes Software Corp. |
//|                                        https://www.metaquotes.net |
//+------------------------------------------------------------------+
#property copyright "Copyright © 2006, MetaQuotes Software Corp."
#property link      "https://www.metaquotes.net"

#property show_inputs
extern int MaxLimit = 1000;
//+------------------------------------------------------------------+
//| script program start function                                    |
//+------------------------------------------------------------------+
int start()
  {
   int handle;
   handle = FileOpen("FindLevels.txt", FILE_CSV|FILE_WRITE, '\t');
   FileWrite(handle, "Cost", "Bars Num");
   double d1 = Low[iLowest(NULL, 0, MODE_LOW, MaxLimit, 0)];
   double d2 = High[iHighest(NULL, 0, MODE_HIGH, MaxLimit, 0)];
   for (double d = d1; d d2; d += 0.0001)
     {
       double a = 0.0;
       for(int i = 0; i MaxLimit; i++)
           if(d > Low[i] && d High[i])
               a+=1;
       FileWrite(handle, d, a);
     }
   FileClose(handle);
   return(0);
  }
//+------------------------------------------------------------------+
The script consists of only one function, start(). It runs every time when you call the script. Below you can find the detailed explanation of the source code:
#property show_inputs
extern int MaxLimit = 1000;
The first line specifies that before running the script the user will be asked to select external parameters. In fact, there is a single parameter defined in the second line. MaxLimit deals with the number of the history bars that are used by the program. It is 1000 by default, but the user can change it anytime.
   int handle;
   handle = FileOpen("FindLevels.txt", FILE_CSV|FILE_WRITE, '\t');
   FileWrite(handle, "Cost", "Bars Num");
The first two lines of the start() function deal with the opening the file “FindLevels.txt” with the FILE_CSV (it means that the file is a text table) and FILE_WRITE (it means that the file is opened for writing) parameters. The ‘\t’ parameter indicates that the digits in the file will be split with tabulation. We will have two columns in the file: the first is the “Cost” – the price, the second is “Bars Num” – the number of the bars crossing this price. Using the FileWrite() function, we write the names of the columns in the “FindLevels. txt" file.
   double d1 = Low[iLowest(NULL, 0, MODE_LOW, MaxLimit, 0)];
   double d2 = High[iHighest(NULL, 0, MODE_HIGH, MaxLimit, 0)];
Then we find the minimum and the maximum price from the zero bar to the bar with MaxLimit number in history. iLowest() shows the bar’s index where the lowest price can be found. А Low[] is the lowest price value for this bar. Follow the same procedure for iHighest() и High[].
   for (double d = d1; d <= d2; d += 0.0001)
     {
       double a = 0.0;
       for(int i = 0; i < MaxLimit; i++)
           if(d > Low[i] && d < High[i])
               a+=1;
       FileWrite(handle, d, a);
     }
After that we have a “for” cycle. This cycle runs the prices from the minimum price d1 to the maximum price d2 with the 0.0001 step. The variable “a” is a number of the bars crossing the price "d". The second enclosed cycle runs the MaxLimit history bars and checks if they are crossing the price "d". After the end of the enclosed cycle the FileWrite procedure writes the price “d” and the number of the bars “a” into the file.
   FileClose(handle);
   return(0);
At the end of the procedure start() we close the file and finish the procedure using the the return() function. After we have written the script we can compile it by clicking the “Compile” button and run it in MetaTrader from the “Scripts” section in the “Navigator” window.
File with Excel
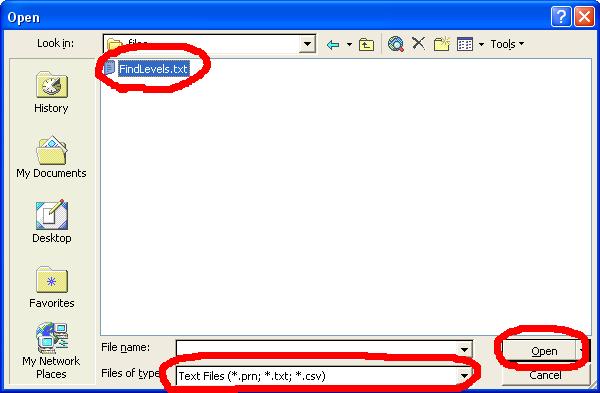
After calling the script, the program creates “FindLevels.txt” file in the “\experts\files\” folder. Let
us open it with Excel. In order to do it we have to call Microsoft Excel and to click the “Open” button,
then to select the “Text Files” file type, find the file we need and click the "Open" button.
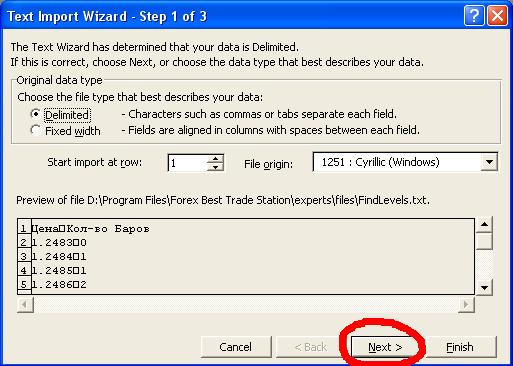
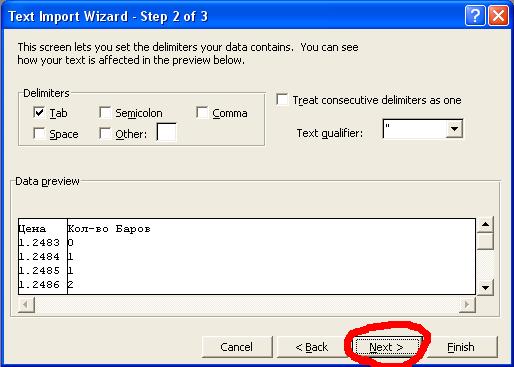
We do not have to change anything in the first two windows, just click the “Next” button.
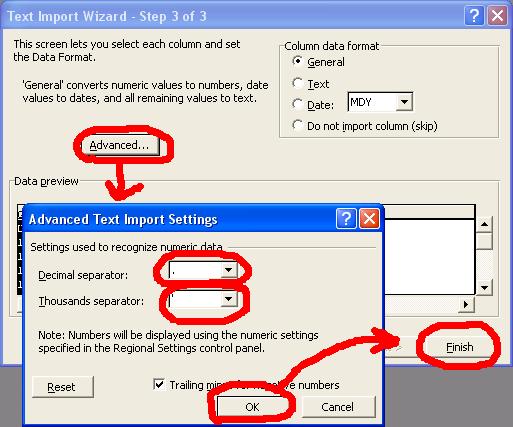
In the third window, click the “Advanced” button, select the dot symbol (“.”) for the decimal point and the ' (apostrophe) symbol for the millesimal point. Then click “Ok" and "Finish".
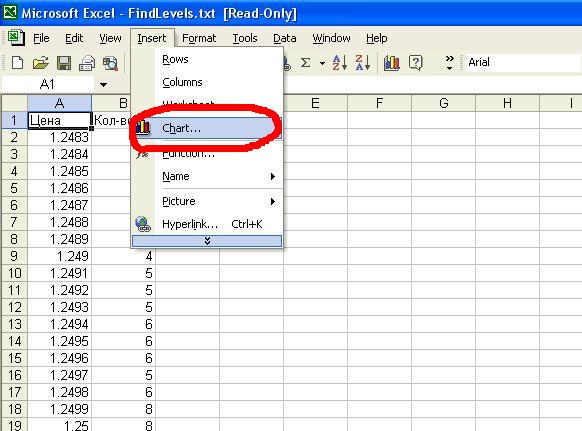
As a result, we have the two columns in Excel. Now we have to plot the chart. Choose Insert-> “Chart”.
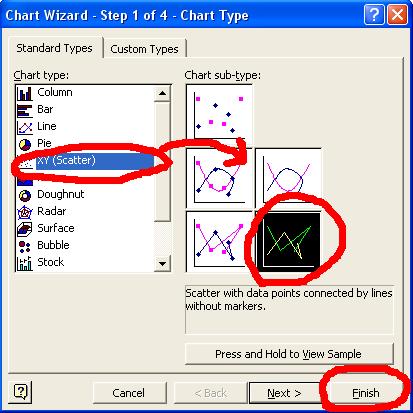
The last thing we have to do is to select the type of the future chart and the type
of its displaying.
Finally we have the bar chart on price.
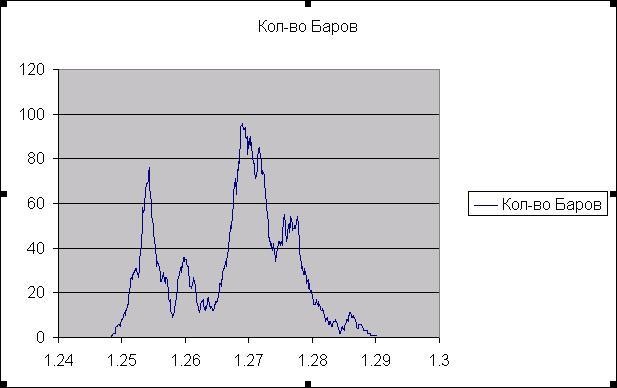
You can see that the minimums of the chart are located at 1.2582, 1.2616, 1.2644, 1.2705, 1.2712, 1.2730, 1.2744, 1.2850, 1.2879 points. These are the support/resistance levels.
We can compare the results for 10.11.2006 with those of the previous date, 9.10. 2006:
RES 4 $1.2880 the maximum of August, 31
RES 3 $1.2865 1.618 the swing aim after the fall from 1.2795 to1.2680
RES 2 $1.2830 Fibonacci 76.4% from 1.2940 to 1.2485
RES 1 $1.2805 the hour resistance
Current level: 1.2760
SUP 1 $1.2745 the line of the 3 weeks rising trend
SUP 2 $1.2730 Fibonacci 61.8% from 1.2680 to 1.2820
SUP 3 $1.2715 Fibonacci 76.4% from 1.2680 to 1.2820
SUP 4 $1.2680 the minimum of November, 3
As we can see, we have a good correlation between the chart and the forecasts. It
means that the levels we have found are really the support/resistance levels!
Translated from Russian by MetaQuotes Ltd.
Original article: https://www.mql5.com/ru/articles/1439
Warning: All rights to these materials are reserved by MetaQuotes Ltd. Copying or reprinting of these materials in whole or in part is prohibited.
This article was written by a user of the site and reflects their personal views. MetaQuotes Ltd is not responsible for the accuracy of the information presented, nor for any consequences resulting from the use of the solutions, strategies or recommendations described.
 Displaying of Support/Resistance Levels
 Genetic Algorithms vs. Simple Search in the MetaTrader 4 Optimizer

 Pivot Points Helping to Define Market Trends
- Free trading apps
- Over 8,000 signals for copying
- Economic news for exploring financial markets
You agree to website policy and terms of use
http://img292.imageshack.us/img292/8081/05182007061931ni9.png
17 errors