
Advanced Analysis of a Trading Account

Introduction
This article deals with the mechanical trading system's operation analysis system using MQLab™ Graphic Report script.
The article objectives are:
- To show the advantage of the obtained analysis results compared to the standard report in MetaTrader 4 terminal.
- To describe the analysis methods for defining all trading factors.
- To draw conclusions on improving trading after the obtained report is examined in details.
One of my most promising trading tactics is used for analysis. Since the Expert Advisor operating on a demo account is not likely to be used by general public, I will not reveal the trading tactics in the article. Also, certain columns are removed from the published articles and trading deals are sorted so that not to disclose the trading methods.
Each copy of the Expert Advisor operates on its own currency pair with certain settings, and it is impossible to evaluate and understand all the details of the performed deals using conventional MetaTrader 4 terminal tools. More advanced analytical systems are required in order to understand what is going on.
Setting the problem:
1. Analyze the work of the Expert Advisor(s) on a trading account.
2. Detect the parameters negatively affecting the operation of the Expert Advisor(s), general profitability, as well as profitability of each currency pair in particular.
3. Find patterns affecting profitability, drawdowns, expectation, etc.
4. Find optimal combinations of currency pairs for further work.
5. Generate the list of possible improvements in the expert system operation.
Reasons and Prerequisites for Generating an Extended Report
Starting with MetaTrader 3, traders can take part in the international currency exchange without leaving their homes.
| wikipedia.org |
|---|
| FOREX stands for FOReign EXchange. Forex term is commonly used to refer to the exchange of freely convertible currencies, rather than the entire multitude of currency exchange transactions. Usually, "Forex market" phrase is used to underline the market (rather than administrative) principle of quotes generation. Depending on their objectives, Forex market operations can be of trading, speculative, hedging and regulating (central banks' currency interventions) nature. Also, Forex often means purely speculative currency trading performed via commercial banks or dealing centers and involving a leverage, i.e. margin trading. Since the terminal's development and transfer to MetaTrader 4 platform, it is now possible to perform fully automated deals 24 hours a day. Since the terminals of both generations allowed users to perform deals with several currency pairs on a single trading account, trading statistics is common for the entire account. The developers have not provided technical ability to analyze performed deals for a particular currency pair, as well as for the group of them. Operation statistics has remained unchanged since the third generation of the terminal. In anticipation of next-gen MetaTrader 5 terminal, the hope for better report parameters, including more details and scalability, remains. Over the past 3 years, multiple automated trading tactics (mechanical trading systems, Expert Advisors, trading robots, etc.) have appeared on the Internet, 3 international championships have been performed but analysis methods have not undergone any significant changes. More detailed statistics has been used at the Championship but it cannot be applied to your own or other traders' trading accounts. In my opinion, evaluation of trading parameters of Expert Advisors sold on the Internet is the most flawed. The Forum is also full of pseudo-Grails. Their developers are sure their trading tactics are profitable and many users examining published reports start flooding Forum topics. The 4th reason of generating an extended report is investors. In my view, this group of people is almost completely deprived of any analytical data on trading operations performed on demo or any other account. Even when having access to a desired account, an investor is not able to evaluate the system's operation to the full extent. Most often such investments end up in losses. Considering this issue, my task was to develop more informative and flexible report. The work on improving the information content is going on, but I will show its current features and application methods. |
Extended Report Features
The extended report contains all parameters of the standard one. Calculation equations are taken from the source. Below is the table of innovations implemented for the extended report.
 |
The detailed report is an HTML file. It contains all standard report parameters, as well as some additional ones:
|
 |
The graphical part of the report is presented in the form of dynamic Flash graphs, charts and pie diagrams.
|
 |
|
 |
Number of characters pie diagram displays the number of closed orders by currency pairs. Each pair has its definite color and the highest values are displayed as an extended piece of diagram. |
 |
Count win/loss dynamics column chart displays the number of profitable and loss-making deals by each order type for a currency pair. |
 |
Automatic generation of XML files for generating charts. The files are saved on your PC's hard drive. |
 |
The system of checks and warnings. This system prevents incorrectly set parameters in script settings and warns of incorrect data. |
 |
Report filtration system. Report can be generated in many ways by applying various filters. As a result of filtration, you receive exactly the report you need for analysis. |
 |
Date and time filter. This function is necessary if you want to generate the report for a specific date or time. The report includes all closed, open and pending orders, open and close conditions of which coincide with specified time settings. |
 |
Order comment filter. This function filters the report by a particular parameter and adds the deals having comments coinciding with the ones specified in the script settings. |
 |
MAGIC number filter is necessary for separation of automatic and manual trading or an automatic trading by several Expert Advisors on a single account. This report contains only positions and orders with their MAGIC parameter coinciding with the one specified in the script settings. |
 |
Enabling/disabling display of pending orders in the report. It is not always necessary to display pending orders in the report as they do not carry any data useful for analysis while revealing Expert Advisor's operation or manual trading logics to third parties. |
 |
Enabling/disabling display of open positions in the report. It is not always necessary to display open orders in the report to investors or any other person. |
 |
Enabling/disabling display of zero-profit positions in the report. If deal history contains zero-profit orders, it would be better to exclude them from the report as they do not carry any important data, while leading to decreasing such calculation data as profit factor, mathematical expectation, etc. |
 |
Filter for displaying only necessary columns. This filter is necessary for efficient information presentation, as well as for concealing important trading strategy elements without distorting trading results. |
 |
Sorting orders when generating a report. It can be set by any of the columns. This function accelerates understanding of the report, as well as fits together report parameters by a number of parameters, for example, by Open and Close time, currency pair, lot, etc. The orders can be saved in the report, so that the Expert Advisor's operation logic cannot be revealed. This refers to multicurrency strategies where opening can be performed on various currency pairs by a certain parameter. |
 |
Calculating an order's lifetime This parameter is important for understanding Expert Advisor's parameters or trading style. The longer the order's lifetime, the higher the probability that the entry signal's accuracy is low and the order is located in loss-making state for quite a long time. If the lifetime is short, that means the strategy is based on scalping and pipsing. This sometimes leads to tightening the rules of performing trading deals by dealing centers. |
 |
Calculation of the amount of profit and loss in pips of the currency pair. This parameter provides greater understanding of the objectives reached by the Expert Advisor. This calculation does not depend on the dynamic lot, leverage, etc. |
Expert Advisor's Operation Analysis
As previously mentioned, the Expert Advisor trades on each currency pair separately having no multicurrency rules. Each currency pair is optimized separately in the strategy tester. Since in most cases, any strategy can trade on almost any currency pair, it was decided to test the Expert Advisor on 22 currency pairs. The initial deposit has been calculated based on the number of currency pairs * 10К. As a result, there is an initial balance of 220К. Before the initial testing, each currency pair has been optimized on a 1 month interval.
After 2 months of the fully automated trading, we finally can examine the results. MQLab™ Graphic Report has been launched on a demo account and the following results have been obtained.
The full report can be downloaded and examined. The name of the attached file is FULL_Report.zip (440.3 Kb)
Below are 2 comparative tables of standard and extended reports.
Standard report
| Gross Profit: | 950 592.08 | Gross Loss: | -161 808.04 | Total Net Profit: | 788 784.04 |
| Profit Factor: | 5.87 | Expected Payoff: | 949.20 | ||
| Absolute Drawdown: | 0.00 | Maximal Drawdown: | 40 642.35 (4.26%) | Relative Drawdown: | 4.26% (40 642.35) |
| Total Trades: | 831 | Short Positions (won %): | 221 (65.16 %) | Long Positions (won %): | 610 (81.15 %) |
| Profit Trades (% of total): | 639 (76.90 %) | Loss trades (% of total): | 192 (23.10 %) | ||
| Largest | profit trade: | 31 003.20 | loss trade: | -11 536.80 | |
| Average | profit trade: | 1 487.62 | loss trade: | -842.75 | |
| Maximum | consecutive wins ($): | 46 (74 627.29) | consecutive losses ($): | 11 (-2 050.92) | |
| Maximal | consecutive profit (count): | 115 265.49 (45) | consecutive loss (count): | -26 364.80 (4) | |
| Average | consecutive wins: | 9 | consecutive losses: | 3 |
Extended report
| Gross Profit: | 950592.08 | Gross Loss: | -161808.04 | Total Net Profit: | 788784.04 |
| Profit Factor: | 5.87 | Avg. profit factor: | 1.77 | Expected Payoff: | 949.20 |
| Absolute Drawdown: | 0.00 | Maximal Drawdown: | 19084.09 (2.31%) | Relative Drawdown: | 2.67% (12866.40) |
| Total Trades: | 831 | Short Positions (won %): | 221 (65.16 %) | Long Positions (won %): | 610 (81.15 %) |
| Profit Trades (% of total): | 639 (76.90 %) | Loss trades (% of total): | 192 (23.10 %) | ||
| Largest | profit trade: | 31003.20 | loss trade: | -11536.80 | |
| Average | profit trade: | 1487.62 | loss trade: | -842.75 | |
| Maximum | consecutive wins ($): | 57 (105530.75) | consecutive losses ($): | 8 (-764.64) | |
| Maximal | consecutive profit (count): | 107894.42 (28) | consecutive loss (count): | -11536.80 (1) | |
| Average | consecutive wins: | 6 | consecutive losses: | 1 |
Comparing 2 tables, we can see that some parameters (Maximal Drawdown, Relative Drawdown, etc.) of the extended report do not coincide with the standard one. These are not report generation errors. As mentioned earlier, closed positions in report history are sorted so (set in the script settings) that the logic of the Expert Advisor's operation is not revealed.
The following sorting is applied to the extended report:
1. By open time, in ascending order.
2. By close time, in descending order.
The standard report has no such functionality.
Of course, all parameters are calculated based on the applied sorting method.
Also, the new parameter appears in the extended report – Avg. profit factor (calculation of the average profit factor). I think that it is more informative and stable in the provided data compared to Profit Factor of the standard report. Profit Factor can change its value in quite a large range depending on received profit or loss. As this parameter is one of the most important ones in the report, Profit Factor is calculated for each closed position and displayed in a separate table column in the extended report. Avg. profit factor is calculated and displayed the same way. With this data, it is possible to create a comparative chart that clearly displays how trading activity on the account took place. Also, it is possible to see when performed deals started to deteriorate this figure.
| A small digression. |
|---|
| Since the website's engine does not support the insertion of external Flash and it is also impossible to upload them on the server, charts and a pie diagram are replaced with static images in the article. When viewing full reports, it is possible to see the whole animated graphic design. |
The extended report has comparative chart of Profit Factor and Avg. profit factor parameters.

Profit factor and Avg. profit factor
By moving the horizontal slider, we can see the intervals where there were rises and falls of Profit Factor parameter, Avg. profit factor line is smoother, dots with values represent the deals.
From personal experience, I can say that Profit Factor parameter should always exceed Avg. profit factor. In this case, the system is considered to be more profitable and stable. If Profit Factor is below Avg. profit factor, then it is time to raise alarm and examine what happened in details.
In my case, the profit factor has decreased below average on the 376th performed deal, i.e. almost in 3 weeks after the start of testing. Examining the detailed report, I assured myself that this trading system should be optimized on new data approximately once in 2 weeks. In that case, the efficiency of Profit Factor and Avg. profit factor parameters should remain at a high level.
So, we have determined that the Expert Advisor should be optimized at least once in 2 weeks. Consequently, a number of other issues arise:
- What currency pairs should be optimized?
- How many currency pairs are involved in trading?
- Which currency pairs are profitable and which ones are loss-making?
- etc.
Graphical diagrams have been added to the extended report in order to clarify all these questions. The first pie diagram displays the number of deals at each of the currency pairs, while the second one shows statistics of operations by order types with calculation of profitable and loss-making deals performed at each currency pair.
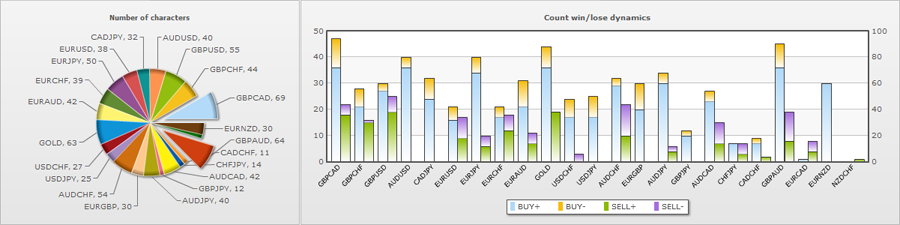
While analyzing Numbers of characters pie diagram, we can quickly define the currency pairs with the lowest number of performed deals relative to other pairs. Also, currency pairs with the highest number of performed deals are marked in the diagram as extending "pieces of the pie".
After selecting currency pairs with the lowest number of performed deals from the pie diagram, namely EURCAD, CADCHF, CHFJPY, GBPJPY, we examine statistics on the types of performed deals on Count win / lose dynamics diagram. This diagram shows that these currency pairs not only perform small amount of deals but also performed profitable deals is compensated by the same number of loss-making deals. It means that this currency pair is not profitable and, most probably, it is even loss-making.
Separation by types of performed transactions and calculation of these deals are mostly necessary to define, in what direction the Expert Advisor trades best with certain parameters. If setting parameters for Long and Short positions are different, then it is easier to configure or disable trading in a certain direction or optimize buy or sell parameters after receiving this statistics.
We continue analyzing Count win/lose dynamics diagram and define 7 currency pairs trading only in one direction: AUDUSD, CADJPY, USDJPY, EURGBP, GBPJPY, EURNZD, NZDCHF and 3 more currency pairs USDCHF, CADCHF, EURCAD having quite large ratio of the order types. It is quite difficult to detect this fact in the standard report. I have assigned all mentioned currency pairs to the group of the ones trading in one direction. The reasons for such work may depend on the trading strategy or the market dynamics. In other words, we can examine the currency pair chart in order to determine the reasons for such activity and see everything in details. I will not do that in this article. It is mostly a manual work and each trader can do that on his or her own.
So, we have managed to define a number of currency pairs, the efficiency of which is called into question. The main doubt is the value of the drawdown on the tested account. Maximal Drawdown: 2.31%. We can assume that the currency pairs have been used in trading process that have decreased the trading efficiency or caused losses preventing efficient work on other currency pairs. In order to define these currency pairs and exclude them from trading, we should analyze each currency pair separately. The standard report does not provide such possibility, that is why I've had to develop the method for filtration of currency pairs.
Using the script with the currency pair filtration, we can receive a detailed report on each of them, including calculation of its profitability, drawdown, mathematical expectation, etc. The diagrams based on filtered data are generated the same way.
| A small digression: |
|---|
| In the developed report script, MQLab™ Graphic Report is preceded by a number of settings that allow analyzing the deals not only of a definite currency pair, but also filter them by MAGIC number, as well as by order comments. These filters can easily divide the account not only by currency pairs but also by trading type (manual or automatic) or analyze only the orders having certain parameters in comments, for example, market entry conditions. Also, it is possible to combine MAGIC, currency pair and position or order comments. |
Full reports for each currency pair are attached to the present article as .rar files: Records_of_individual_currencies.part1.rar (3.8 Mb) and Records_of_individual_currencies.part2.rar (3.7 Mb)
Let's make a summary table based on the obtained results.
| |
Gross Profit |
Gross Loss |
Total Net Profit |
Profit Factor |
Avg. profit factor |
Exp. Payoff |
Abs. Drawd. |
Max. Drawd. |
Total Trades |
Short Positions |
Long Positions |
|---|---|---|---|---|---|---|---|---|---|---|---|
GBPCAD |
61664.17 |
-13150.13 |
48514.04 |
4.69 |
1.30 |
703.10 |
0.00 |
11881.17 |
69 |
22 |
47 |
GBPCHF |
47115.25 |
-1913.54 |
45201.71 |
24.62 |
5.47 |
1027.31 |
0.00 |
1207.25 |
44 |
16 |
28 |
GBPUSD |
114853.31 |
-49384.70 |
65468.61 |
2.33 |
0.46 |
1190.34 |
0.00 |
21779.60 |
55 |
25 |
30 |
AUDUSD |
61227.83 |
-3446.00 |
57781.83 |
17.77 |
1.97 |
1444.55 |
0.00 |
3203.00 |
40 |
0 |
40 |
CADJPY |
28850.51 |
-2051.31 |
26799.20 |
14.06 |
4.69 |
837.48 |
989.40 |
1810.67 |
32 |
0 |
32 |
EURUSD |
100910.61 |
-20189.97 |
80720.64 |
5.00 |
2.60 |
2124.23 |
9366.76 |
11961.84 |
38 |
17 |
21 |
EURJPY |
28099.81 |
-2606.26 |
25493.55 |
10.78 |
2.70 |
509.87 |
0.00 |
1847.96 |
50 |
10 |
40 |
EURCHF |
35744.67 |
-1843.92 |
33900.75 |
19.39 |
6.68 |
869.25 |
0.00 |
873.09 |
39 |
18 |
21 |
EURAUD |
64700.63 |
-8901.46 |
55799.17 |
7.27 |
3.63 |
1328.55 |
387.07 |
3924.49 |
42 |
11 |
31 |
GOLD |
32420.35 |
-7822.52 |
24597.83 |
4.14 |
0.60 |
390.44 |
0.00 |
3622.96 |
63 |
19 |
44 |
USDCHF |
36319.19 |
-12784.30 |
23534.89 |
2.84 |
1.67 |
871.66 |
1786.53 |
11316.21 |
27 |
3 |
24 |
USDJPY |
36685.74 |
-989.33 |
35696.41 |
37.08 |
17.45 |
1427.86 |
772.90 |
963.67 |
25 |
0 |
25 |
AUDCHF |
30933.15 |
-8692.07 |
22241.08 |
3.56 |
1.37 |
411.87 |
208.19 |
4935.03 |
54 |
22 |
32 |
EURGBP |
35672.84 |
-5011.78 |
30661.06 |
7.12 |
3.56 |
1022.04 |
0.00 |
2414.87 |
30 |
0 |
30 |
AUDJPY |
46455.59 |
-937.53 |
45518.06 |
49.55 |
8.74 |
1137.95 |
0.00 |
853.87 |
40 |
6 |
34 |
GBPJPY |
4799.64 |
-181.80 |
4617.84 |
26.40 |
5.28 |
384.82 |
0.00 |
181.80 |
12 |
0 |
12 |
AUDCAD |
63144.23 |
-4970.32 |
58173.91 |
12.70 |
5.08 |
1385.09 |
263.21 |
3734.90 |
42 |
15 |
27 |
CHFJPY |
6878.05 |
-1119.51 |
5758.54 |
6.14 |
2.46 |
411.32 |
653.61 |
755.33 |
14 |
7 |
7 |
CADCHF |
2367.64 |
-57.69 |
2309.95 |
41.04 |
9.12 |
210.00 |
0.00 |
33.36 |
11 |
2 |
9 |
GBPAUD |
93826.55 |
-15290.74 |
78535.81 |
6.14 |
2.79 |
1227.12 |
513.66 |
11497.83 |
64 |
19 |
45 |
EURCAD |
2524.46 |
-463.16 |
2061.30 |
5.45 |
4.36 |
229.03 |
124.98 |
311.34 |
9 |
8 |
1 |
EURNZD |
15388.79 |
0.00 |
15388.79 |
0.00 |
0.00 |
512.96 |
0.00 |
0.00 |
30 |
0 |
30 |
NZDCHF |
9.07 |
0.00 |
9.07 |
0.00 |
0.00 |
9.07 |
0.00 |
0.00 |
1 |
1 |
0 |
Average value |
41330.09 |
-7035.13 |
34294.96 |
13.39 |
4 |
855.04 |
655.06 |
4309.14 |
36.13 |
10 |
27 |
After making a table and calculating the value for each parameter, I have introduced a "threshold", below which the parameters cannot fall, in my opinion. If obtained results are below the threshold, trading efficiency on this currency pair is low or loss-making.
Let's make a selection of currency pairs with the division into groups. The main parameters will be Gross Profit and Total Trades
Good trading:
Gross Profit |
Gross Loss |
Total Net Profit |
Profit Factor |
Avg. profit factor |
Exp. Payoff |
Abs. Drawd. |
Max. Drawd. |
Total Trades |
Short Positions |
Long Positions |
|
|---|---|---|---|---|---|---|---|---|---|---|---|
GBPCAD |
61664.17 |
-13150.13 |
48514.04 |
4.69 |
1.30 |
703.10 |
0.00 |
11881.17 |
69 |
22 |
47 |
GBPCHF |
47115.25 |
-1913.54 |
45201.71 |
24.62 |
5.47 |
1027.31 |
0.00 |
1207.25 |
44 |
16 |
28 |
GBPUSD |
114853.31 |
-49384.70 |
65468.61 |
2.33 |
0.46 |
1190.34 |
0.00 |
21779.60 |
55 |
25 |
30 |
AUDUSD |
61227.83 |
-3446.00 |
57781.83 |
17.77 |
1.97 |
1444.55 |
0.00 |
3203.00 |
40 |
0 |
40 |
EURUSD |
100910.61 |
-20189.97 |
80720.64 |
5.00 |
2.60 |
2124.23 |
9366.76 |
11961.84 |
38 |
17 |
21 |
EURAUD |
64700.63 |
-8901.46 |
55799.17 |
7.27 |
3.63 |
1328.55 |
387.07 |
3924.49 |
42 |
11 |
31 |
AUDJPY |
46455.59 |
-937.53 |
45518.06 |
49.55 |
8.74 |
1137.95 |
0.00 |
853.87 |
40 |
6 |
34 |
AUDCAD |
63144.23 |
-4970.32 |
58173.91 |
12.70 |
5.08 |
1385.09 |
263.21 |
3734.90 |
42 |
15 |
27 |
GBPAUD |
93826.55 |
-15290.74 |
78535.81 |
6.14 |
2.79 |
1227.12 |
513.66 |
11497.83 |
64 |
19 |
45 |
The full report can be downloaded and examined. The name of the attached file is Good_trade_Report.zip (402.9 Kb)
The table contains currency pairs with Gross Profit and Total Trades trading parameters above the average value. These are the most profitable currency pairs on the tested account. In other words, they are driving force of profit.
Medium trading:
Gross Profit |
Gross Loss |
Total Net Profit |
Profit Factor |
Avg. profit factor |
Exp. Payoff |
Abs. Drawd. |
Max. Drawd. |
Total Trades |
Short Positions |
Long Positions |
|
|---|---|---|---|---|---|---|---|---|---|---|---|
CADJPY |
28850.51 |
-2051.31 |
26799.20 |
14.06 |
4.69 |
837.48 |
989.40 |
1810.67 |
32 |
0 |
32 |
EURJPY |
28099.81 |
-2606.26 |
25493.55 |
10.78 |
2.70 |
509.87 |
0.00 |
1847.96 |
50 |
10 |
40 |
EURCHF |
35744.67 |
-1843.92 |
33900.75 |
19.39 |
6.68 |
869.25 |
0.00 |
873.09 |
39 |
18 |
21 |
GOLD |
32420.35 |
-7822.52 |
24597.83 |
4.14 |
0.60 |
390.44 |
0.00 |
3622.96 |
63 |
19 |
44 |
USDCHF |
36319.19 |
-12784.30 |
23534.89 |
2.84 |
1.67 |
871.66 |
1786.53 |
11316.21 |
27 |
3 |
24 |
USDJPY |
36685.74 |
-989.33 |
35696.41 |
37.08 |
17.45 |
1427.86 |
772.90 |
963.67 |
25 |
0 |
25 |
AUDCHF |
30933.15 |
-8692.07 |
22241.08 |
3.56 |
1.37 |
411.87 |
208.19 |
4935.03 |
54 |
22 |
32 |
EURGBP |
35672.84 |
-5011.78 |
30661.06 |
7.12 |
3.56 |
1022.04 |
0.00 |
2414.87 |
30 |
0 |
30 |
EURNZD |
15388.79 |
0.00 |
15388.79 |
0.00 |
0.00 |
512.96 |
0.00 |
0.00 |
30 |
0 |
30 |
The full report can be downloaded and examined. The name of the attached file is Average_trade_Report.zip (395.7 Kb)
Selection in the table has been performed based on the following principle:
1. Gross Profit < Gross Profit average value
2. Gross Profit > (Gross Profit average value / 2)
The only pair that does not meet this condition is EURNZD. It is included in the table because not a single loss-making trade has been performed at this pair.
Bad trading:
Gross Profit |
Gross Loss |
Total Net Profit |
Profit Factor |
Avg. profit factor |
Exp. Payoff |
Abs. Drawd. |
Max. Drawd. |
Total Trades |
Short Positions |
Long Positions |
|
|---|---|---|---|---|---|---|---|---|---|---|---|
GBPJPY |
4799.64 |
-181.80 |
4617.84 |
26.40 |
5.28 |
384.82 |
0.00 |
181.80 |
12 |
0 |
12 |
CHFJPY |
6878.05 |
-1119.51 |
5758.54 |
6.14 |
2.46 |
411.32 |
653.61 |
755.33 |
14 |
7 |
7 |
CADCHF |
2367.64 |
-57.69 |
2309.95 |
41.04 |
9.12 |
210.00 |
0.00 |
33.36 |
11 |
2 |
9 |
EURCAD |
2524.46 |
-463.16 |
2061.30 |
5.45 |
4.36 |
229.03 |
124.98 |
311.34 |
9 |
8 |
1 |
NZDCHF |
9.07 |
0.00 |
9.07 |
0.00 |
0.00 |
9.07 |
0.00 |
0.00 |
1 |
1 |
0 |
The full report can be downloaded and examined. The name of the attached file is Bad_Trade_Report.zip (364.7 Kb)
This group of currency pairs is an obstacle in our trading activity. It prevents the driving force of our most profitable currency pairs from gaining full efficiency.
After dividing all symbols by groups, it is interesting to know how trading parameters for each group would have been if each group had been tested separately from other ones on the account. To do this, we should apply the system of filtration and grouping by currency pairs.
Good trading:
| Gross Profit: | 653898.17 | Gross Loss: | -118184.39 | Total Net Profit: | 535713.78 |
| Profit Factor: | 5.53 | Avg. profit factor: | 1.68 | Expected Payoff: | 1234.36 |
| Absolute Drawdown: | 0.00 | Maximal Drawdown: | 19168.35 (2.92%) | Relative Drawdown: | 3.81% (10933.02) |
| Total Trades: | 434 | Short Positions (won %): | 131 (66.41 %) | Long Positions (won %): | 303 (81.19 %) |
| Profit Trades (% of total): | 333 (76.73 %) | Loss trades (% of total): | 101 (23.27 %) | ||
| Largest | profit trade: | 31003.20 | loss trade: | -11536.80 | |
| Average | profit trade: | 1963.66 | loss trade: | -1170.14 | |
| Maximum | consecutive wins ($): | 26 (74353.47) | consecutive losses ($): | 8 (-764.64) | |
| Maximal | consecutive profit (count): | 98581.16 (19) | consecutive loss (count): | -11536.80 (1) | |
| Average | consecutive wins: | 6 | consecutive losses: | 1 |
Medium trading:
| Gross Profit: | 312961.61 | Gross Loss: | -52744.84 | Total Net Profit: | 260216.77 |
| Profit Factor: | 5.93 | Avg. profit factor: | 1.77 | Expected Payoff: | 712.92 |
| Absolute Drawdown: | 0.00 | Maximal Drawdown: | 7621.15 (1.98%) | Relative Drawdown: | 1.98% (7621.15) |
| Total Trades: | 365 | Short Positions (won %): | 74 (66.22 %) | Long Positions (won %): | 291 (79.73 %) |
| Profit Trades (% of total): | 281 (76.99 %) | Loss trades (% of total): | 84 (23.01 %) | ||
| Largest | profit trade: | 23814.20 | loss trade: | -2877.67 | |
| Average | profit trade: | 1113.74 | loss trade: | -627.91 | |
| Maximum | consecutive wins ($): | 32 (67689.94) | consecutive losses ($): | 12 (-7482.88) | |
| Maximal | consecutive profit (count): | 67689.94 (32) | consecutive loss (count): | -7482.88 (12) | |
| Average | consecutive wins: | 6 | consecutive losses: | 2 |
Bad trading:
| Gross Profit: | 16578.86 | Gross Loss: | -1822.16 | Total Net Profit: | 14756.70 |
| Profit Factor: | 9.10 | Avg. profit factor: | 3.12 | Expected Payoff: | 313.97 |
| Absolute Drawdown: | 0.00 | Maximal Drawdown: | 388.36 (0.17%) | Relative Drawdown: | 0.17% (388.36) |
| Total Trades: | 47 | Short Positions (won %): | 18 (55.56 %) | Long Positions (won %): | 29 (86.21 %) |
| Profit Trades (% of total): | 35 (74.47 %) | Loss trades (% of total): | 12 (25.53 %) | ||
| Largest | profit trade: | 3348.53 | loss trade: | -388.36 | |
| Average | profit trade: | 473.68 | loss trade: | -151.85 | |
| Maximum | consecutive wins ($): | 10 (7119.78) | consecutive losses ($): | 2 (-364.18) | |
| Maximal | consecutive profit (count): | 7119.78 (10) | consecutive loss (count): | -388.36 (1) | |
| Average | consecutive wins: | 3 | consecutive losses: | 1 |
From this statistics, we can see that the currency pairs from "Bad trading" do not have much impact on profitability. This group of currency pairs can be excluded from tests.
Let's join "Good trading" and "Medium trading" groups in a single report.
The full report on 2 groups can be downloaded and examined. The name of the attached file is Good_Average_trade_Report.zip (437.4 Kb)
| Gross Profit: | 966859.78 | Gross Loss: | -170929.23 | Total Net Profit: | 795930.55 |
| Profit Factor: | 5.66 | Avg. profit factor: | 1.70 | Expected Payoff: | 996.16 |
| Absolute Drawdown: | 0.00 | Maximal Drawdown: | 19084.09 (2.33%) | Relative Drawdown: | 2.70% (12866.40) |
| Total Trades: | 799 | Short Positions (won %): | 205 (66.34 %) | Long Positions (won %): | 594 (80.47 %) |
| Profit Trades (% of total): | 614 (76.85 %) | Loss trades (% of total): | 185 (23.15 %) | ||
| Largest | profit trade: | 31003.20 | loss trade: | -11536.80 | |
| Average | profit trade: | 1574.69 | loss trade: | -923.94 | |
| Maximum | consecutive wins ($): | 37 (67514.27) | consecutive losses ($): | 8 (-764.64) | |
| Maximal | consecutive profit (count): | 108047.10 (19) | consecutive loss (count): | -11536.80 (1) | |
| Average | consecutive wins: | 6 | consecutive losses: | 2 |
After comparing the obtained results of the joined groups with full report's statistics, we can see the following parameters.
Full report |
Combined report |
|
|---|---|---|
| Gross Profit: | 950592.08 | 966859.78 |
| Gross Loss: | -161808.04 | -170929.23 |
| Total Net Profit: | 788784.04 | 795930.55 |
| Profit Factor: | 5.87 | 5.66 |
| Avg. profit factor: | 1.77 | 1.70 |
| Expected Payoff: | 949.20 | 996.16 |
| Absolute Drawdown: | 0.00 | 0.00 |
| Maximal Drawdown: | 19084.09 (2.31%) | 19084.09 (2.33%) |
| Relative Drawdown: | 2.67% (12866.40) | 2.70% (12866.40) |
| Total Trades: | 831 | 799 |
| Short Positions (won %): | 221 (65.16 %) | 205 (66.34 %) |
| Long Positions (won %): | 610 (81.15 %) | 594 (80.47 %) |
| Profit Trades (% of total): | 639 (76.90 %) | 614 (76.85 %) |
| Loss trades (% of total): | 192 (23.10 %) | 185 (23.15 %) |
| Largest profit trade: | 31003.20 | 31003.20 |
| Largest loss trade: | -11536.80 | -11536.80 |
| Average profit trade: | 1487.62 | 1574.69 |
| Average loss trade: | -842.75 | -923.94 |
| Maximum consecutive wins ($): | 57 (105530.75) | 37 (67514.27) |
| Maximum consecutive losses ($): | 8 (-764.64) | 8 (-764.64) |
| Maximal consecutive profit (count): | 107894.42 (28) | 108047.10 (19) |
| Maximal consecutive loss (count): | -11536.80 (1) | -11536.80 (1) |
| Average consecutive wins: | 6 | 6 |
| Average consecutive losses: | 1 | 2 |
We can see from the table that some parameters have increased their value while some have decreased it, though no sharp differences can be seen. This is due to the fact that "Bad trading" group is not a loss-making one. Here we can see a special case of obtained results where each currency pair increases the overall profitability.
What else can I do to increase profitability and reliability of this trading method? Examining the obtained results and reports for each currency pair, I have come to the conclusion that the expert system lacks one small detail for more successful trading. This detail is market entry rules depending on other currency pairs.
Since each currency pair is traded individually and optimization is performed for each pair, therefore, settings for each pair are different. It means that the pairs will enter the market at different times and in different directions while following the signal. But after defining the leading pairs, we may bind to it.
Creating the Deal Filtration System
The filtration system described in the article has not been developed and tested by anyone before. So please treat it as a theory that I will describe in details.
Let's create a balance table based on "Good trading" group's statistics for each currency pair.
Since this group contains 9 currency pairs, we assign from 1 to 9 points to each of them. The lowest parameters from the column receives 1 point, the highest one receives 9 points.
If parameters of 2 or more pairs coincide, the same number of points is added.
Abs. Drawd. and Max. Drawd. columns are evaluated in reverse order.
P. |
Gross Profit |
P. |
Gross Loss |
P. |
Total Net Profit |
P. |
Profit Factor |
P. |
Avg. profit factor |
P. |
Exp. Payoff |
P. |
Abs. Drawd. |
P. |
Max. Drawd. |
P. |
Total Trades |
P. |
Short Positions |
P. |
Long Positions |
|
|---|---|---|---|---|---|---|---|---|---|---|---|---|---|---|---|---|---|---|---|---|---|---|
GBPCAD |
4 |
61664.17 |
4 |
-13150.13 |
3 |
48514.04 |
2 |
4.69 |
2 |
1.30 |
1 |
703.10 |
5 |
0.00 |
3 |
11881.17 |
7 |
69 |
8 |
22 |
9 |
47 |
GBPCHF |
2 |
47115.25 |
8 |
-1913.54 |
1 |
45201.71 |
8 |
24.62 |
8 |
5.47 |
2 |
1027.31 |
5 |
0.00 |
8 |
1207.25 |
4 |
44 |
5 |
16 |
3 |
28 |
GBPUSD |
9 |
114853.31 |
1 |
-49384.70 |
7 |
65468.61 |
1 |
2.33 |
1 |
0.46 |
4 |
1190.34 |
5 |
0.00 |
1 |
21779.60 |
5 |
55 |
9 |
25 |
4 |
30 |
AUDUSD |
3 |
61227.83 |
7 |
-3446.00 |
5 |
57781.83 |
7 |
17.77 |
3 |
1.97 |
8 |
1444.55 |
5 |
0.00 |
7 |
3203.00 |
2 |
40 |
1 |
0 |
7 |
40 |
EURUSD |
8 |
100910.61 |
2 |
-20189.97 |
9 |
80720.64 |
3 |
5.00 |
4 |
2.60 |
9 |
2124.23 |
1 |
9366.76 |
2 |
11961.84 |
1 |
38 |
6 |
17 |
1 |
21 |
EURAUD |
6 |
64700.63 |
5 |
-8901.46 |
4 |
55799.17 |
5 |
7.27 |
6 |
3.63 |
6 |
1328.55 |
3 |
387.07 |
5 |
3924.49 |
3 |
42 |
3 |
11 |
5 |
31 |
AUDJPY |
1 |
46455.59 |
9 |
-937.53 |
2 |
45518.06 |
9 |
49.55 |
9 |
8.74 |
3 |
1137.95 |
5 |
0.00 |
9 |
853.87 |
2 |
40 |
2 |
6 |
6 |
34 |
AUDCAD |
5 |
63144.23 |
6 |
-4970.32 |
6 |
58173.91 |
6 |
12.70 |
7 |
5.08 |
7 |
1385.09 |
4 |
263.21 |
6 |
3734.90 |
3 |
42 |
4 |
15 |
2 |
27 |
GBPAUD |
7 |
93826.55 |
3 |
-15290.74 |
8 |
78535.81 |
4 |
6.14 |
5 |
2.79 |
5 |
1227.12 |
2 |
513.66 |
4 |
11497.83 |
6 |
64 |
7 |
19 |
8 |
45 |
Let's sum up the points obtained by each of the currency pairs.
| Currency pair | Obtained points |
Result |
|---|---|---|
| GBPCAD | 4 + 4 + 3 + 2 + 2 + 1 + 5 + 3 + 7 + 8 + 9 |
48 |
| GBPCHF | 2 + 8 + 1 + 8 + 8 + 2 + 5 + 8 + 4 + 5 + 3 |
54 |
| GBPUSD | 9 + 1 + 7 + 1 + 1 + 4 + 5 + 1 + 5 + 9 + 4 |
47 |
| AUDUSD | 3 + 7 + 5 + 7 + 3 + 8 + 5 + 7 + 2 + 1 + 7 |
55 |
| EURUSD | 8 + 2 + 9 + 3 + 4 + 9 + 1 + 2 + 1 + 6 + 1 |
46 |
| EURAUD | 6 + 5 + 4 + 5 + 6 + 6 + 3 + 5 + 3 + 3 + 5 |
51 |
| AUDJPY | 1 + 9 + 2 + 9 + 9 + 3 + 5 + 9 + 2 + 2 + 6 |
57 |
| AUDCAD | 5 + 6 + 6 + 6 + 7 + 7 + 4 + 6 + 3 + 4 + 2 |
56 |
| GBPAUD | 7 + 3 + 8 + 4 + 5 + 5 + 2 + 4 + 6 + 7 + 8 |
59 |
Now, we can define the most balanced currency pair.
Now, let's define the balance of base and quote currencies separately. To do this, we should make the following table with separated base and quote currencies.
| Currency pair | Base currency | Quote currency |
|---|---|---|
| GBPAUD | GBP | AUD |
| AUDJPY | AUD | JPY |
| AUDCAD | AUD | CAD |
| AUDUSD | AUD | USD |
| GBPCHF | GBP | CHF |
| EURAUD | EUR | AUD |
| GBPCAD | GBP | CAD |
| GBPUSD | GBP | USD |
| EURUSD | EUR | USD |
Let's calculate the number of times base and quote currencies are repeated and make the following table.
| GBP | AUD | EUR | JPY | CAD | USD | CHF | |
|---|---|---|---|---|---|---|---|
| Base currency | 4 |
3 |
2 |
||||
| Quote currency | 2 |
1 |
2 |
3 |
1 |
After summing Short Positions and Long Positions for all currency pairs of "Good trading" and "Medium trading" groups, we have the following results:
Short Positions = 203 deals
Long Positions = 581 deals
Since there are lots of trades in both directions, we will try to consider all possible filtration cases.
Let's develop the deal filtration system that will prevent a deal being opened in a reverse direction. This system is based on the base currency for Short Positions and Long Positions at all currency pairs.
Do not open |
If a Short Positions deal is active at the following symbol |
If a Long Positions deal is active at the following symbol |
|
|---|---|---|---|
GBPCAD |
Long Positions: | GBPCHF, GBPUSD, GBPJPY, GBPAUD | EURGBP |
| Short Positions: | EURGBP |
GBPCHF, GBPUSD, GBPJPY, GBPAUD |
|
GBPCHF |
Long Positions: | GBPCAD, GBPUSD, GBPJPY, GBPAUD |
EURGBP |
| Short Positions: | EURGBP |
GBPCAD, GBPUSD, GBPJPY, GBPAUD |
|
GBPUSD |
Long Positions: | GBPCAD, GBPCHF, GBPJPY, GBPAUD |
EURGBP |
| Short Positions: | EURGBP |
GBPCAD, GBPCHF, GBPJPY, GBPAUD | |
AUDUSD |
Long Positions: | AUDCHF, AUDJPY, AUDCAD |
EURAUD, GBPAUD |
| Short Positions: | EURAUD, GBPAUD |
AUDCHF, AUDJPY, AUDCAD | |
CADJPY |
Long Positions: | CADCHF |
GBPCAD, AUDCAD, EURCAD |
| Short Positions: | GBPCAD, AUDCAD, EURCAD |
CADCHF | |
EURUSD |
Long Positions: | EURJPY, EURCHF, EURAUD, EURGBP, EURCAD, EURNZD |
|
| Short Positions: | EURJPY, EURCHF, EURAUD, EURGBP, EURCAD, EURNZD | ||
EURJPY |
Long Positions: | EURUSD, EURCHF, EURAUD, EURGBP, EURCAD, EURNZD |
|
| Short Positions: | EURUSD, EURCHF, EURAUD, EURGBP, EURCAD, EURNZD | ||
EURCHF |
Long Positions: | EURUSD, EURJPY, EURAUD, EURGBP, EURCAD, EURNZD |
|
| Short Positions: | EURUSD, EURJPY, EURAUD, EURGBP, EURCAD, EURNZD | ||
EURAUD |
Long Positions: | EURUSD, EURJPY, EURCHF, EURGBP, EURCAD, EURNZD |
|
| Short Positions: | EURUSD, EURJPY, EURCHF, EURGBP, EURCAD, EURNZD | ||
USDCHF |
Long Positions: | USDJPY |
GBPUSD, AUDUSD, EURUSD |
| Short Positions: | GBPUSD, AUDUSD, EURUSD |
USDJPY | |
USDJPY |
Long Positions: | USDCHF |
GBPUSD, AUDUSD, EURUSD |
| Short Positions: | GBPUSD, AUDUSD, EURUSD |
USDCHF | |
AUDCHF |
Long Positions: | AUDUSD, AUDJPY, AUDCAD |
EURAUD, GBPAUD |
| Short Positions: | EURAUD, GBPAUD |
AUDUSD, AUDJPY, AUDCAD | |
EURGBP |
Long Positions: | EURUSD, EURJPY, EURCHF, EURAUD, EURCAD, EURNZD |
|
| Short Positions: | EURUSD, EURJPY, EURCHF, EURAUD, EURCAD, EURNZD | ||
AUDJPY |
Long Positions: | AUDUSD, AUDCHF, AUDCAD |
EURAUD, GBPAUD |
| Short Positions: | EURAUD, GBPAUD |
AUDUSD, AUDCHF, AUDCAD | |
GBPJPY |
Long Positions: | GBPCAD, GBPCHF, GBPUSD, GBPAUD |
EURGBP |
| Short Positions: | EURGBP |
GBPCAD, GBPCHF, GBPUSD, GBPAUD | |
AUDCAD |
Long Positions: | AUDUSD, AUDCHF, AUDJPY |
EURAUD, GBPAUD |
| Short Positions: | EURAUD, GBPAUD |
AUDUSD, AUDCHF, AUDJPY | |
CHFJPY |
Long Positions: | GBPCHF, EURCHF, USDCHF, AUDCHF, CADCHF, NZDCHF | |
| Short Positions: | GBPCHF, EURCHF, USDCHF, AUDCHF, CADCHF, NZDCHF |
||
CADCHF |
Long Positions: | CADJPY |
GBPCAD, AUDCAD, EURCAD |
| Short Positions: | GBPCAD, AUDCAD, EURCAD |
CADJPY | |
GBPAUD |
Long Positions: | GBPCAD, GBPCHF, GBPUSD, GBPJPY |
EURGBP |
| Short Positions: | EURGBP |
GBPCAD, GBPCHF, GBPUSD, GBPJPY | |
EURCAD |
Long Positions: | EURUSD, EURJPY, EURCHF, EURAUD, EURGBP, EURNZD |
|
| Short Positions: | EURUSD, EURJPY, EURCHF, EURAUD, EURGBP, EURNZD | ||
EURNZD |
Long Positions: | EURUSD, EURJPY, EURCHF, EURAUD, EURGBP, EURCAD |
|
| Short Positions: | EURUSD, EURJPY, EURCHF, EURAUD, EURGBP, EURCAD |
Let's develop the deal filtration system that will prevent a deal being opened in a reverse direction. This system is based on the quote currency for Short Positions and Long Positions at all currency pairs.
Do not open |
If a Short Positions deal is active at the following symbol |
If a Long Positions deal is active at the following symbol |
|
|---|---|---|---|
GBPCAD |
Long Positions: | AUDCAD, EURCAD | CADCHF, CADJPY |
| Short Positions: | CADCHF, CADJPY |
AUDCAD, EURCAD | |
GBPCHF |
Long Positions: | EURCHF, USDCHF, AUDCHF, CADCHF | |
| Short Positions: | EURCHF, USDCHF, AUDCHF, CADCHF | ||
GBPUSD |
Long Positions: | AUDUSD, EURUSD | USDCHF, USDJPY |
| Short Positions: | USDCHF, USDJPY | AUDUSD, EURUSD | |
AUDUSD |
Long Positions: | GBPUSD, EURUSD | USDCHF, USDJPY |
| Short Positions: | USDCHF, USDJPY | GBPUSD, EURUSD | |
CADJPY |
Long Positions: | EURJPY, USDJPY, AUDJPY, GBPJPY, CHFJPY | |
| Short Positions: | EURJPY, USDJPY, AUDJPY, GBPJPY, CHFJPY | ||
EURUSD |
Long Positions: | GBPUSD, AUDUSD |
USDCHF, USDJPY |
| Short Positions: | USDCHF, USDJPY | GBPUSD, AUDUSD | |
EURJPY |
Long Positions: | CADJPY, USDJPY, AUDJPY, GBPJPY, CHFJPY | |
| Short Positions: | CADJPY, USDJPY, AUDJPY, GBPJPY, CHFJPY | ||
EURCHF |
Long Positions: | GBPCHF, USDCHF, AUDCHF, CADCHF, NZDCHF |
|
| Short Positions: | GBPCHF, USDCHF, AUDCHF, CADCHF, NZDCHF | ||
EURAUD |
Long Positions: | GBPAUD |
AUDUSD, AUDCHF, AUDJPY, AUDCAD |
| Short Positions: | AUDUSD, AUDCHF, AUDJPY, AUDCAD | GBPAUD | |
USDCHF |
Long Positions: | GBPCHF, EURCHF, AUDCHF, CADCHF, NZDCHF | |
| Short Positions: | GBPCHF, EURCHF, AUDCHF, CADCHF, NZDCHF | ||
USDJPY |
Long Positions: | CADJPY, EURJPY, AUDJPY, GBPJPY, CHFJPY | |
| Short Positions: | CADJPY, EURJPY, AUDJPY, GBPJPY, CHFJPY | ||
AUDCHF |
Long Positions: | GBPCHF, EURCHF, USDCHF, CADCHF, NZDCHF | |
| Short Positions: | GBPCHF, EURCHF, USDCHF, CADCHF, NZDCHF | ||
EURGBP |
Long Positions: | GBPCAD, GBPCHF, GBPUSD, GBPJPY, GBPAUD | |
| Short Positions: | GBPCAD, GBPCHF, GBPUSD, GBPJPY, GBPAUD | ||
AUDJPY |
Long Positions: | CADJPY, EURJPY, USDJPY, GBPJPY, CHFJPY | |
| Short Positions: | CADJPY, EURJPY, USDJPY, GBPJPY, CHFJPY | ||
GBPJPY |
Long Positions: | CADJPY, EURJPY, USDJPY, AUDJPY, CHFJPY | |
| Short Positions: | CADJPY, EURJPY, USDJPY, AUDJPY, CHFJPY | ||
AUDCAD |
Long Positions: | GBPCAD, EURCAD |
CADJPY, CADCHF |
| Short Positions: | CADJPY, CADCHF | GBPCAD, EURCAD | |
CHFJPY |
Long Positions: | CADJPY, EURJPY, USDJPY, AUDJPY, GBPJPY | |
| Short Positions: | CADJPY, EURJPY, USDJPY, AUDJPY, GBPJPY | ||
CADCHF |
Long Positions: | GBPCHF, EURCHF, USDCHF, AUDCHF, NZDCHF | |
| Short Positions: | GBPCHF, EURCHF, USDCHF, AUDCHF, NZDCHF | ||
GBPAUD |
Long Positions: | EURAUD | AUDUSD, AUDCHF, AUDJPY, AUDCAD |
| Short Positions: | AUDUSD, AUDCHF, AUDJPY, AUDCAD | EURAUD | |
EURCAD |
Long Positions: | CADJPY,CADCHF |
GBPCAD, AUDCAD |
| Short Positions: | GBPCAD, AUDCAD | CADJPY,CADCHF | |
NZDCHF |
Long Positions: | GBPCHF, EURCHF, USDCHF, AUDCHF, CADCHF | |
| Short Positions: | GBPCHF, EURCHF, USDCHF, AUDCHF, CADCHF |
Suppose that the Expert Advisor works at all currency pairs from "Good trading" and "Medium trading" groups.
Let's write a code for GBPCAD currency pair according to the created deal filtration tables:
int start(){
//----
   OpenPositions();
//----
   return(0);
  }
//+------------------------------------------------------------------+
void OpenPositions(){
// --- Short Positions
   if (Signal(Symbol()) == -1){
      if (!ExistPositions(Symbol(), OP_SELL, Magic, 0)) OpenPosition(Symbol(), OP_SELL, 1, 0, 0, Magic);
   }

// --- Long Positions
   if (Signal(Symbol()) == 1){
      if (!ExistPositions(Symbol(), OP_BUY, Magic, 0))  OpenPosition(Symbol(), OP_BUY, 1, 0, 0, Magic);
   }
}

int Signal(string Symbols){
//----
   if (... Sell signal condition...){
      if (Symbol() == Symbols){ // Filtration rules for GBPCAD
         // Rules according to base currency
         if (ExistPositions("GBPCHF", OP_BUY, Magic, 0)) return(0);
         if (ExistPositions("GBPUSD", OP_BUY, Magic, 0)) return(0);
         if (ExistPositions("GBPJPY", OP_BUY, Magic, 0)) return(0);
         if (ExistPositions("GBPAUD", OP_BUY, Magic, 0)) return(0);
         if (ExistPositions("EURGBP", OP_SELL, Magic, 0))return(0);
         // Rules according to quote currency
         if (ExistPositions("AUDCAD", OP_BUY, Magic, 0)) return(0);
         if (ExistPositions("EURCAD", OP_BUY, Magic, 0)) return(0);
         if (ExistPositions("CADCHF", OP_SELL, Magic, 0)) return(0);
         if (ExistPositions("CADJPY", OP_SELL, Magic, 0)) return(0);
      }
      return(-1);
   }
   if (... Buy signal condition...){
      if (Symbol() == Symbols){ // Filtration rules for GBPCAD
         // Rules according to base currency
         if (ExistPositions("GBPCHF", OP_SELL, Magic, 0)) return(0);
         if (ExistPositions("GBPUSD", OP_SELL, Magic, 0)) return(0);
         if (ExistPositions("GBPJPY", OP_SELL, Magic, 0)) return(0);
         if (ExistPositions("GBPAUD", OP_SELL, Magic, 0)) return(0);
         if (ExistPositions("EURGBP", OP_BUY, Magic, 0))  return(0);
         // Rules according to quote currency
         if (ExistPositions("AUDCAD", OP_SELL, Magic, 0)) return(0);
         if (ExistPositions("EURCAD", OP_SELL, Magic, 0)) return(0);
         if (ExistPositions("CADCHF", OP_BUY, Magic, 0)) return(0);
         if (ExistPositions("CADJPY", OP_BUY, Magic, 0)) return(0);
      }
      return(1);
   }
//----
   return(0);
}
I am not going to show the entire code for all pairs here. It is quite similar to the one displayed above and you can write it yourself.
I hope that this filtration theory will reduce the drawdowns and improve the system's reliability.
Conclusion
1. In this article, we have examined more detailed parameters of the report generated by MQLab™ Graphic Report script.
2. Analysis methods for all currency pairs, a separate pair or a group of pairs have been displayed. The possibility of combining has been shown.
3. The Expert Advisor's trading activity has been analyzed and favorable and unfavorable trading factors have been defined.
4. A number of currency pairs have been excluded due to their inefficiency for this strategy.
5. Measures for improving the trading activity have been developed.
Translated from Russian by MetaQuotes Ltd.
Original article: https://www.mql5.com/ru/articles/1383
Warning: All rights to these materials are reserved by MetaQuotes Ltd. Copying or reprinting of these materials in whole or in part is prohibited.
This article was written by a user of the site and reflects their personal views. MetaQuotes Ltd is not responsible for the accuracy of the information presented, nor for any consequences resulting from the use of the solutions, strategies or recommendations described.

 Lite_EXPERT2.mqh: Expert Advisor Implementation Examples
 Visual Optimization of Indicator and Signal Profitability
 Testing and Optimization of Expert Advisors
 Raise Your Linear Trading Systems to the Power
- Free trading apps
- Over 8,000 signals for copying
- Economic news for exploring financial markets
You agree to website policy and terms of use
Is the MQLab Graphic Report still available?
I have tried accessing the site <mqlab.ru> on several occasions but it always seems to be down!
Anyone have any information on the situation?
Is the MQLab Graphic Report still available?
I have tried accessing the site <mqlab.ru> on several occasions but it always seems to be down!
Anyone have any information on the situation?
The site has expired
"The domain name "www.mqlab.ru" has expired and its delegation has been placed on hold. In case the domain name registration is not renewed the domain will be deleted on its "free date"."