Cristian David Castillo Arrieta / Profil
- Information
|
2 Jahre
Erfahrung
|
3
Produkte
|
128
Demoversionen
|
|
0
Jobs
|
1
Signale
|
0
Abonnenten
|
Meine Arbeit konzentriert sich auf das Design, die Optimierung und die Validierung von Expert Advisors, die als koordiniertes Portfolio funktionieren und nicht als isolierte Strategien. Ich wende Korrelationsanalyse, zeitliche Abdeckungsanalyse und Diversifikation nach Anlageklassen an, um Systeme aufzubauen, die nicht von einem einzelnen Instrument oder einem einzelnen Ansatz abhängig sind.
Derzeit verwalte ich algorithmische Portfolios, die Forex, Indizes, Edelmetalle, Energie und US-Aktien umfassen und gleichzeitig über mehrere Handelssitzungen und Zeitrahmen hinweg operieren.
Ich teile meine Erfahrung durch technische Artikel und Open-Source-Tools in dieser Community. Ich bin überzeugt, dass der Übergang vom „Erstellen einzelner EAs" zum „Engineering von Portfolios" die Grenze ist, die das Denken von Privatanlegern vom institutionellen Denken trennt, und dieses Prinzip leitet alles, was ich hier veröffentliche.
Backtests often understate spread, commission, and slippage. This MQL5 analyzer loads closing deals and simulates rising execution costs to measure robustness. It computes the breakeven cost per deal, the cushion over an assumed cost, the net profit and profit factor at that cost, and how many winners turn into losers, then summarizes the result with an A+ to F grade and targeted guidance.
Net profit and win rate tell you how much a strategy made, not how the result is distributed. This article builds a native MQL5 script that reads your closed trades and measures profit concentration: the top-N trade share, the Gini coefficient of the winners, an outlier-dependence stress test that removes the best few winners, and the largest day against a prop-firm consistency limit. It combines these into one A+ to F score with recommendations, running inside MetaTrader 5.
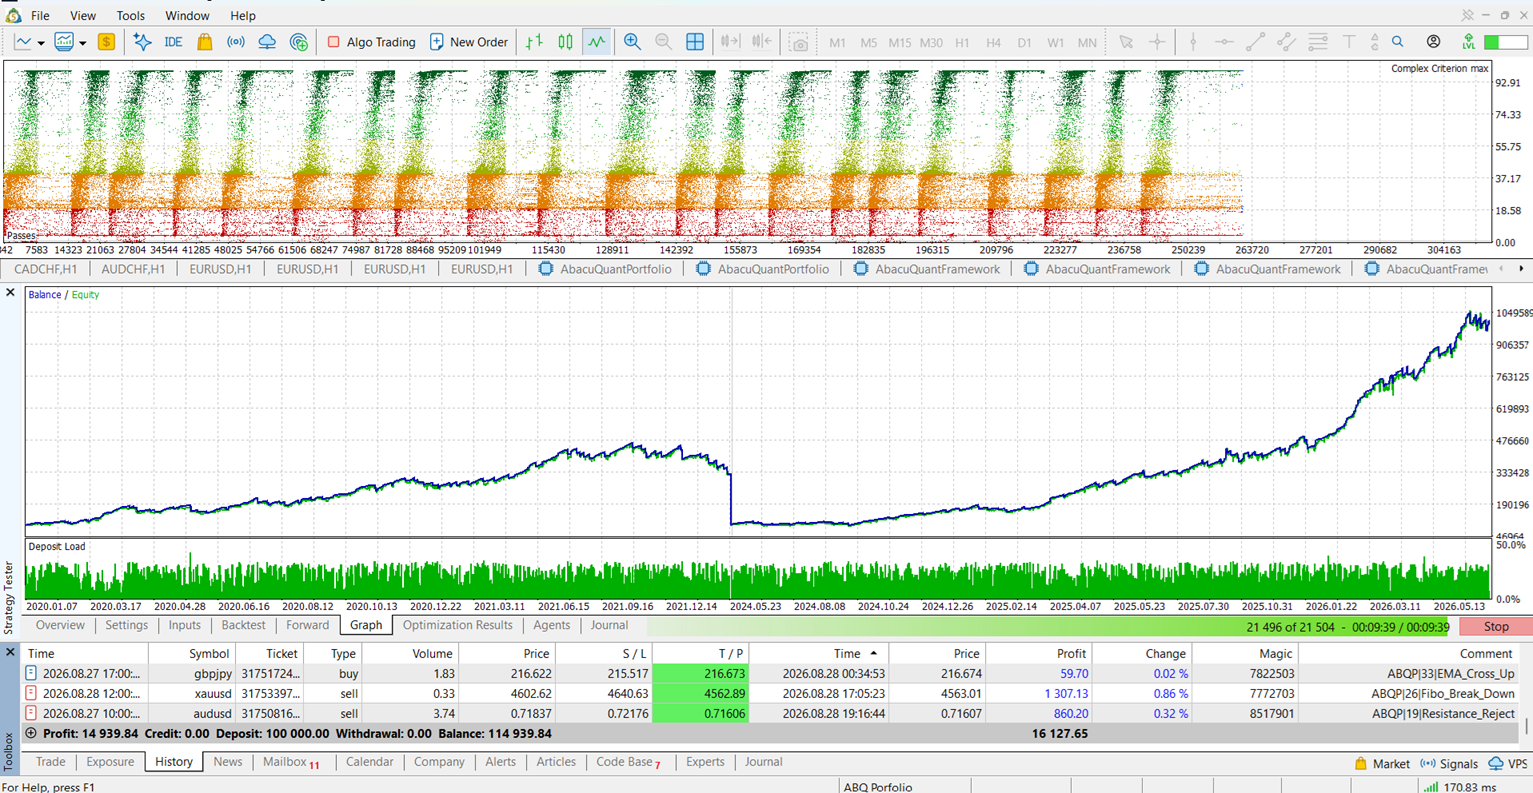
I was in a forum thread today about trailing stops on XAUUSD, and it made me put into words something I've been building my whole approach around for a while: almost every trailing method traders compare — EMA cross, Chandelier, ATR multiples, swing-structure trails — gets judged on a single backtest run over one continuous chunk of history. The "best" multiplier or ladder step that wins that test isn't actually the best method. It's the method that happened to fit whatever mix of trend and chop was sitting in that sample.
The fix I use is simple to describe and annoying to implement properly: split the history into volatility regimes first (I use ATR percentile over a rolling window, expansion vs. compression), then optimize and validate each piece of logic separately per regime instead of once over the whole dataset. A structural trail wins clearly in expansion. In compression it just gets chopped up by noise, and something tighter does better there. Neither method is "the winner" — the regime decides which one applies.
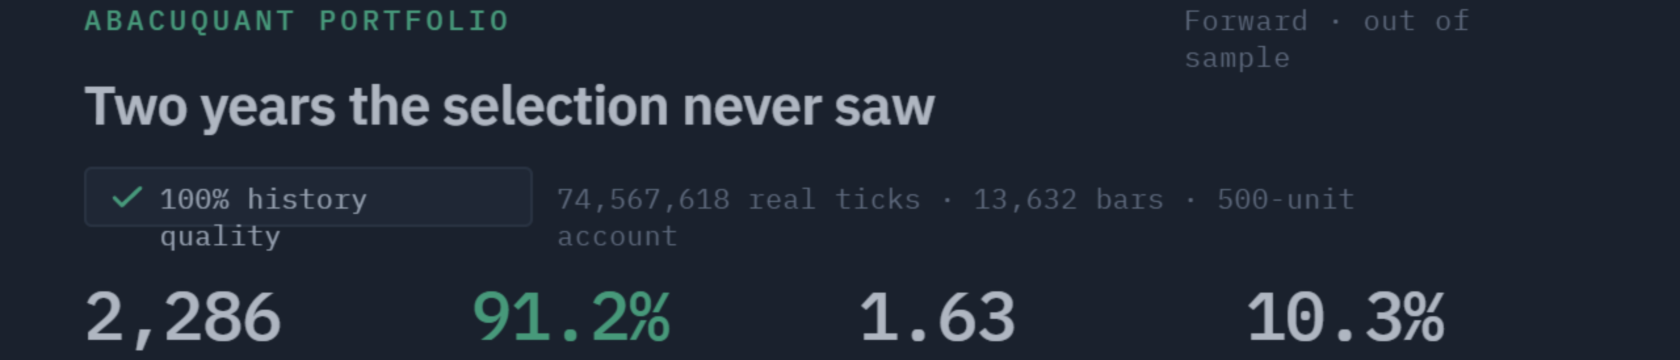
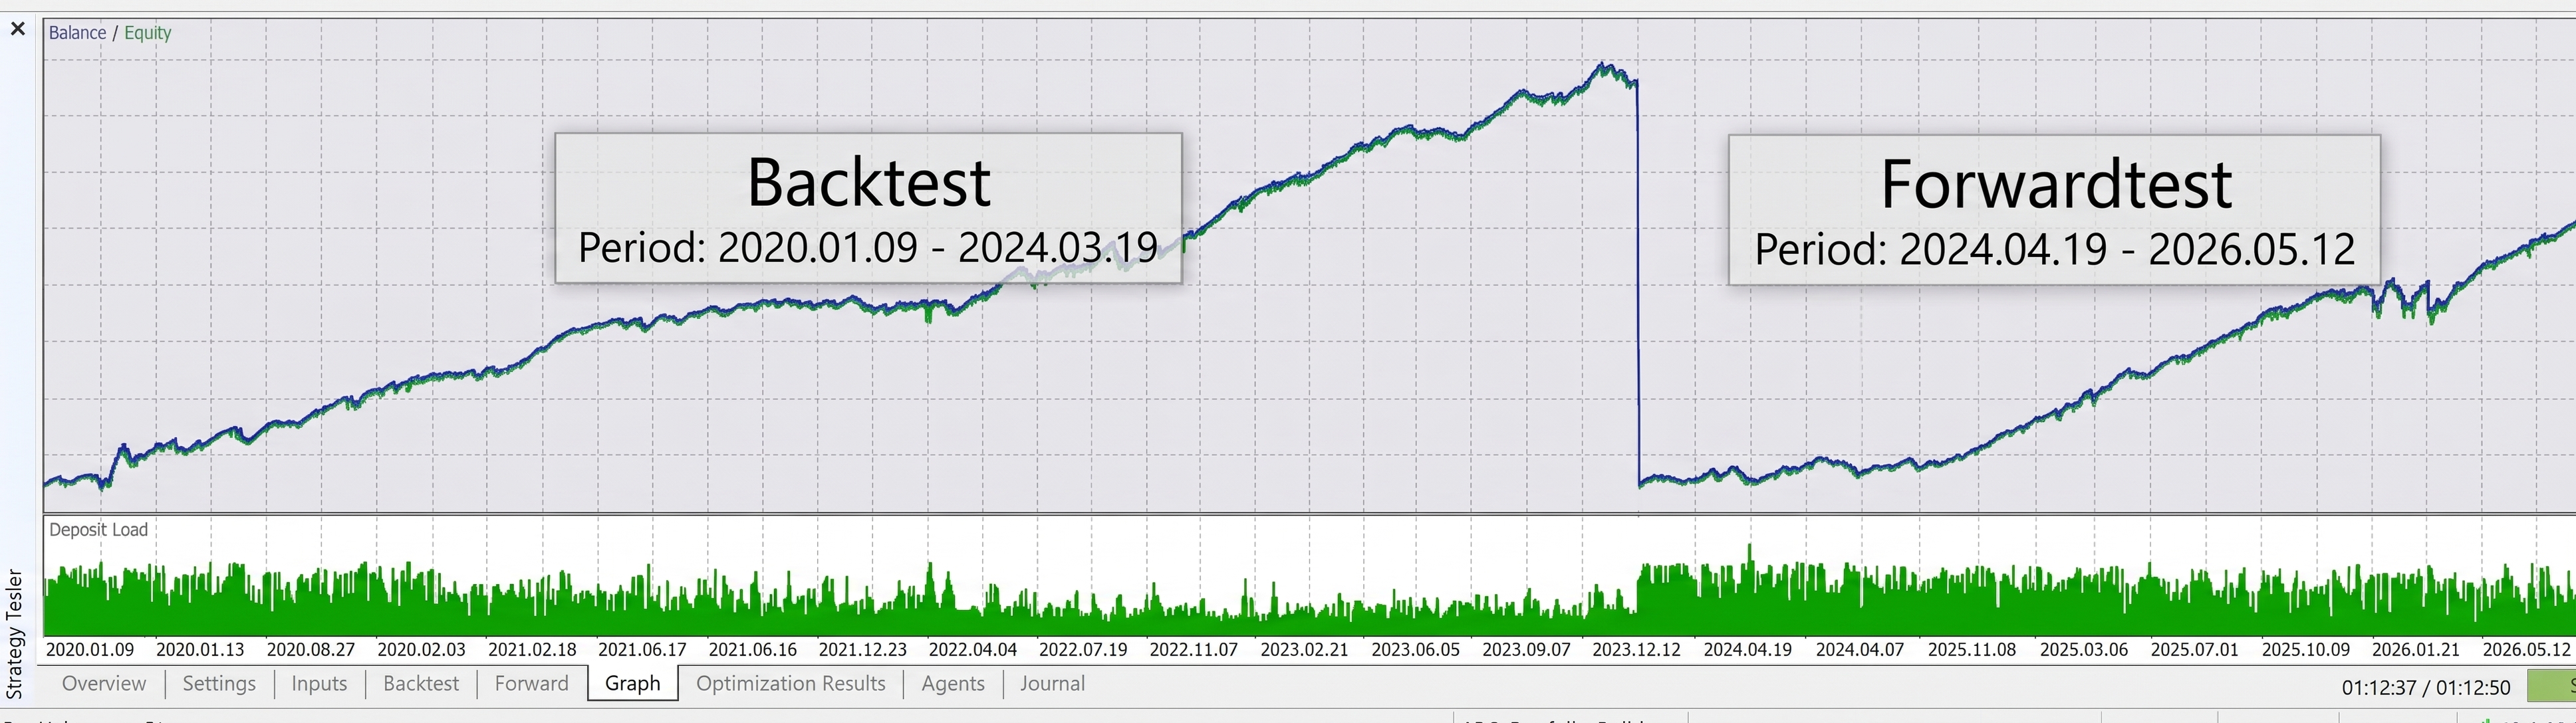
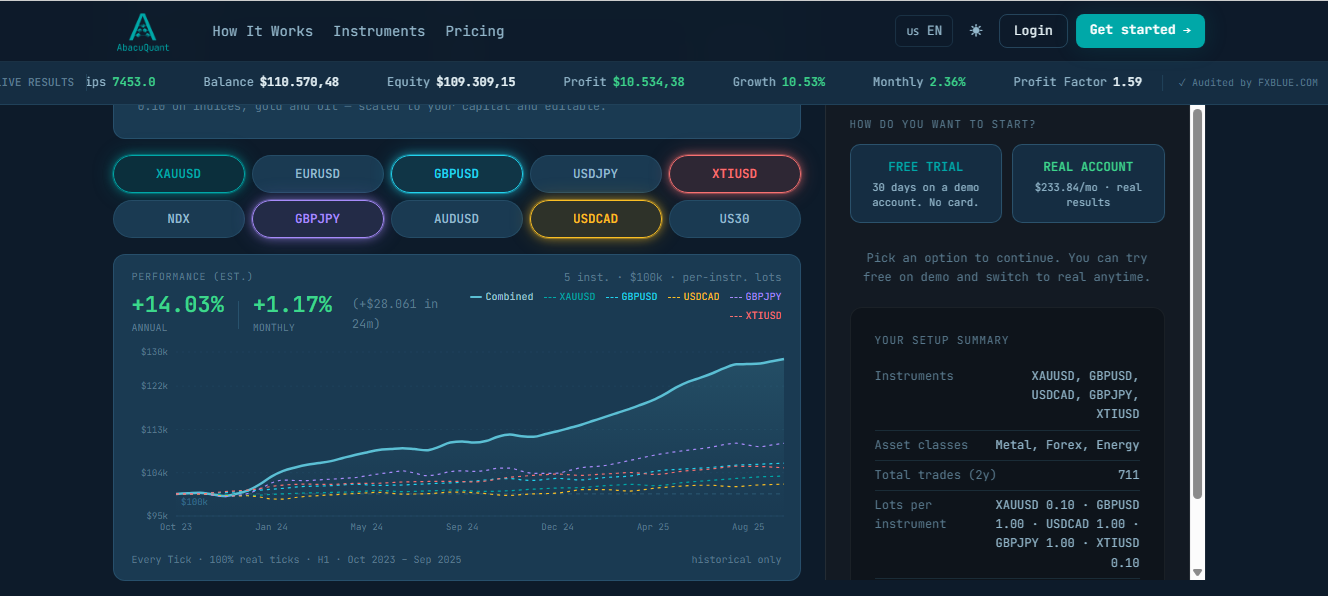
That's the same principle I ended up building AbacuQuant around, just scaled up from one exit rule to an entire portfolio. Instead of one strategy tuned to look good on one backtest, the logic behind each strategy is walk-forward tested and optimized (genetic optimization, not a single curve-fit) across different market regimes and asset classes, forex, metals, indices, energy, ETFs, individual stocks — and then combined into a portfolio specifically to keep cross-asset correlation low (the current version sits under 0.4 correlation across most pairs in the book). The idea isn't "find the one strategy that beats the market." It's "find enough structurally different, regime-validated pieces that the portfolio doesn't fall apart when one regime ends," which is exactly the failure mode people are describing in that XAUUSD thread, just at the position level instead of the portfolio level.
It also runs entirely inside your own MetaTrader account nothing custodial, your funds never move to a third party and the newer version adds the drawdown/consistency rules prop firms check for, since that's become how a lot of people are actually trading it live.
If any of this is useful for how you're thinking about your own trailing logic or portfolio construction, happy to go deeper in the comments. And if you want to see what the regime-validated approach looks like applied across a full portfolio rather than one exit rule, it's at abacuquant.com.
Cristian David Castillo Arrieta
Maximum drawdown is one number that hides what really matters: how often an equity curve declines, how long it stays below a previous peak, and how quickly it recovers. This article builds a native MQL5 tool that reconstructs the underwater curve, breaks it into individual drawdown episodes (depth, duration, recovery time), computes the Ulcer Index, Pain Index, and Recovery Factor, and combines them into a single resilience grade with practical recommendations. No external libraries, no Python, no AI.
Funded Trade Manager MT5 Die meisten finanzierten Konten gehen nicht aufgrund einer schlechten Strategie verloren. Sie gehen an einem einzigen Tag verloren, an dem es zu weit gegangen ist: eine überdimensionierte Position, ein Rache-Trade, eine Überschreitung des täglichen Verlustlimits. Prop Firm Guard ist ein Chart-Panel, das dieselben Limits anwendet, die Ihr Finanzierungsunternehmen anwendet – noch bevor das Unternehmen dies tut. Funktionen Verfolgt Ihr tägliches Verlustlimit und Ihren
Most algo traders optimize Expert Advisors individually but never measure how they behave together on a single account. Correlated strategies amplify drawdowns instead of reducing them, and coverage gaps leave portfolios blind during entire trading sessions. This article builds a complete portfolio scorer in MQL5 that reads daily P&L from backtest CSV files, computes a full Pearson correlation matrix, maps trading activity by hour and weekday, evaluates asset class diversity, and outputs a composite grade from A+ to F. All source code is included; no external libraries are required.
ABQ Portfolio Correlation Scorer: Künstliche Intelligenz auf institutionellem Niveau für das Risikomanagement Die meisten Händler scheitern nicht wegen einer schlechten Einstiegsstrategie, sondern wegen eines unsichtbaren Fehlers in ihrer Portfolioarchitektur . Der häufigste Fehler ist ein übermäßiges Engagement in Korrelationen: Sie eröffnen mehrere Positionen in der Annahme, dass Sie diversifizieren, während Sie in Wirklichkeit das Risiko eines einzigen Faktors vervielfachen. ABQ Portfolio
ABQ Visual Risk Sizer - Institutionelles Risikomanagement & Handelsausführung Kategorie: Utilities / Risikomanagement Die manuelle Berechnung von Losgrößen kostet Zeit und Geld. Im modernen Trading, insbesondere beim Handel mit Fremdkapitalkonten (Prop Firms), kann ein Fehler bei der Losgrößenberechnung oder eine Verzögerung von nur 5 Sekunden bei der Ordereingabe bedeuten, dass die Daily-Drawdown-Regel verletzt wird oder der perfekte Einstiegspreis verloren geht. ABQ Visual Risk Sizer ist