• 情報
2 年
経験
3
製品
128
デモバージョン
0
ジョブ
1
シグナル
0
購読者
財務・国際ビジネスの専門家であり、財務管理を専門としています。MQL5およびPythonの独学開発者として、アルゴリズム取引、マルチアセットポートフォリオの構築、定量的リスク管理に注力しています。

私の仕事の核心は、孤立した戦略ではなく、協調的なポートフォリオとして機能するエキスパートアドバイザーの設計、最適化、検証にあります。相関分析、時間カバレッジマッピング、資産クラスの分散化を活用し、単一の商品や単一のアプローチに依存しないシステムを構築しています。

現在、外国為替、株価指数、貴金属、エネルギー、米国株式にまたがるアルゴリズムポートフォリオを管理しており、複数のセッションと時間軸で同時に運用しています。
このコミュニティでは、技術記事やオープンソースツールを通じて自身の経験を共有しています。「個々のEAを構築する」ことから「ポートフォリオをエンジニアリングする」ことへの転換こそが、リテールと機関投資家の思考を分ける境界線であると確信しており、その信念が私がここで公開するすべてのものの指針となっています。
Cristian David Castillo Arrieta
パブリッシュされたコードHidden Risk of Ruin Auditor
Reads a closed-position trade history (a CSV file, or one generated automatically from the current account's deal history by the companion RuinExport.mq5 script) and reports four independent risk fingerprints: volume escalation after a loss, overlapping same-direction exposure that averages into a worse price, payoff asymmetry between wins and losses, and a classical risk-of-ruin estimate at a stated risk per trade. The four scores combine into a single A-to-F grade with plain-language recommendations. If no CSV is found, the script generates a reproducible demonstration book automatically, so the report is visible on the first run.
50
Cristian David Castillo Arrieta
パブリッシュされた記事Execution Cost and Slippage Sensitivity Analyzer
Execution Cost and Slippage Sensitivity Analyzer

Backtests often understate spread, commission, and slippage. This MQL5 analyzer loads closing deals and simulates rising execution costs to measure robustness. It computes the breakeven cost per deal, the cushion over an assumed cost, the net profit and profit factor at that cost, and how many winners turn into losers, then summarizes the result with an A+ to F grade and targeted guidance.

Cristian David Castillo Arrieta
パブリッシュされた記事Creating a Profit Concentration Analyzer in MQL5
Creating a Profit Concentration Analyzer in MQL5

Net profit and win rate tell you how much a strategy made, not how the result is distributed. This article builds a native MQL5 script that reads your closed trades and measures profit concentration: the top-N trade share, the Gini coefficient of the winners, an outlier-dependence stress test that removes the best few winners, and the largest day against a prop-firm consistency limit. It combines these into one A+ to F score with recommendations, running inside MetaTrader 5.

Cristian David Castillo Arrieta
パブリッシュされたコードPortfolio Correlation and Margin Risk Calculator
Computes the historical Pearson correlation between any set of instruments and the combined margin your account would need to hold all of them at once, as a percentage of your equity. Runs natively in MetaTrader 5 with no external libraries, no Python, and no AI — set your symbol list and lot sizes as inputs and it reports the full matrix in the Experts tab and on the chart, refreshing on a timer.
65
Cristian David Castillo Arrieta
Why the same trailing stop breaks the moment Gold changes character

I was in a forum thread today about trailing stops on XAUUSD, and it made me put into words something I've been building my whole approach around for a while: almost every trailing method traders compare — EMA cross, Chandelier, ATR multiples, swing-structure trails — gets judged on a single backtest run over one continuous chunk of history. The "best" multiplier or ladder step that wins that test isn't actually the best method. It's the method that happened to fit whatever mix of trend and chop was sitting in that sample.

The fix I use is simple to describe and annoying to implement properly: split the history into volatility regimes first (I use ATR percentile over a rolling window, expansion vs. compression), then optimize and validate each piece of logic separately per regime instead of once over the whole dataset. A structural trail wins clearly in expansion. In compression it just gets chopped up by noise, and something tighter does better there. Neither method is "the winner" — the regime decides which one applies.

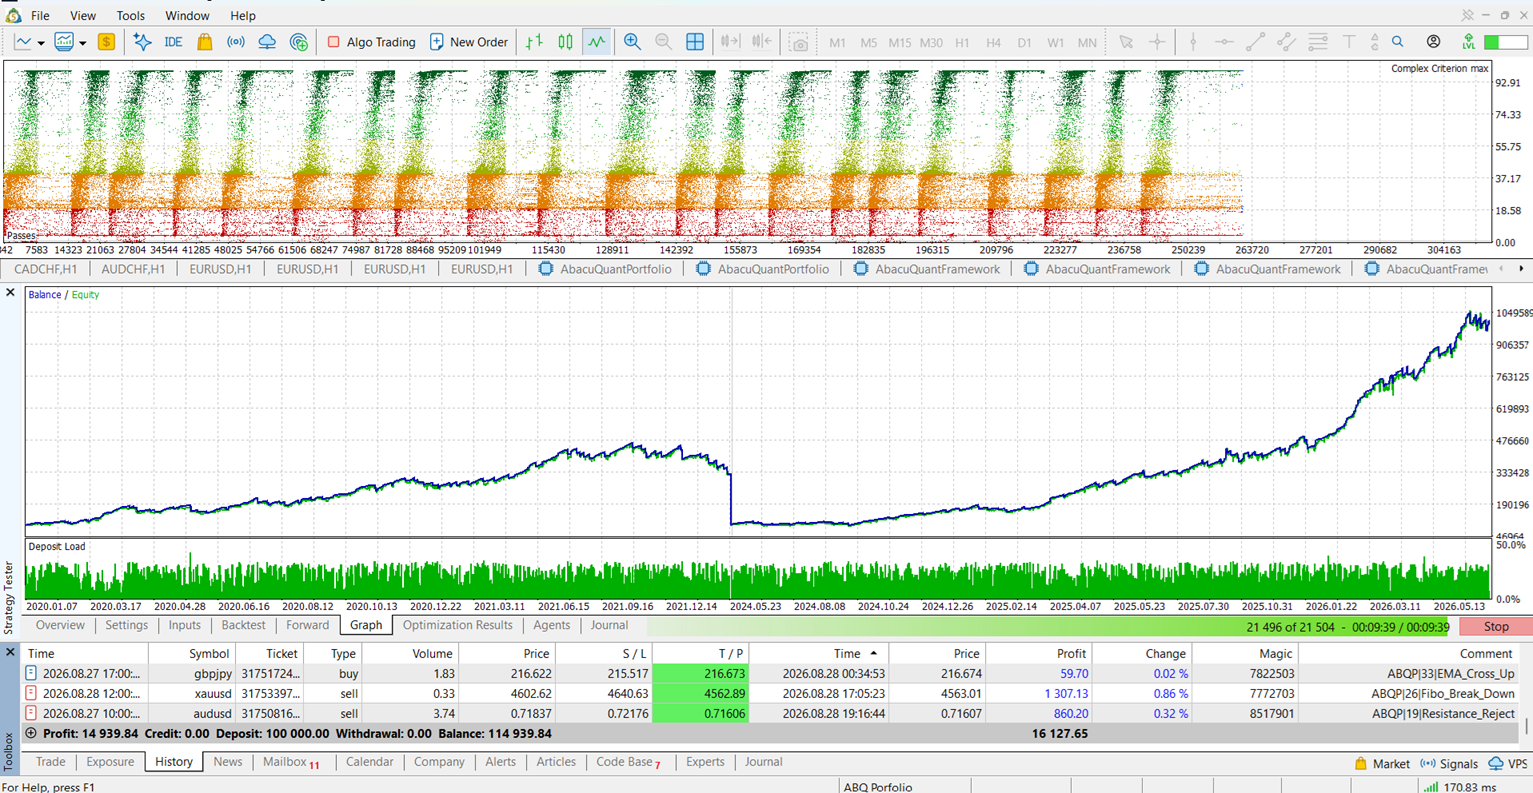
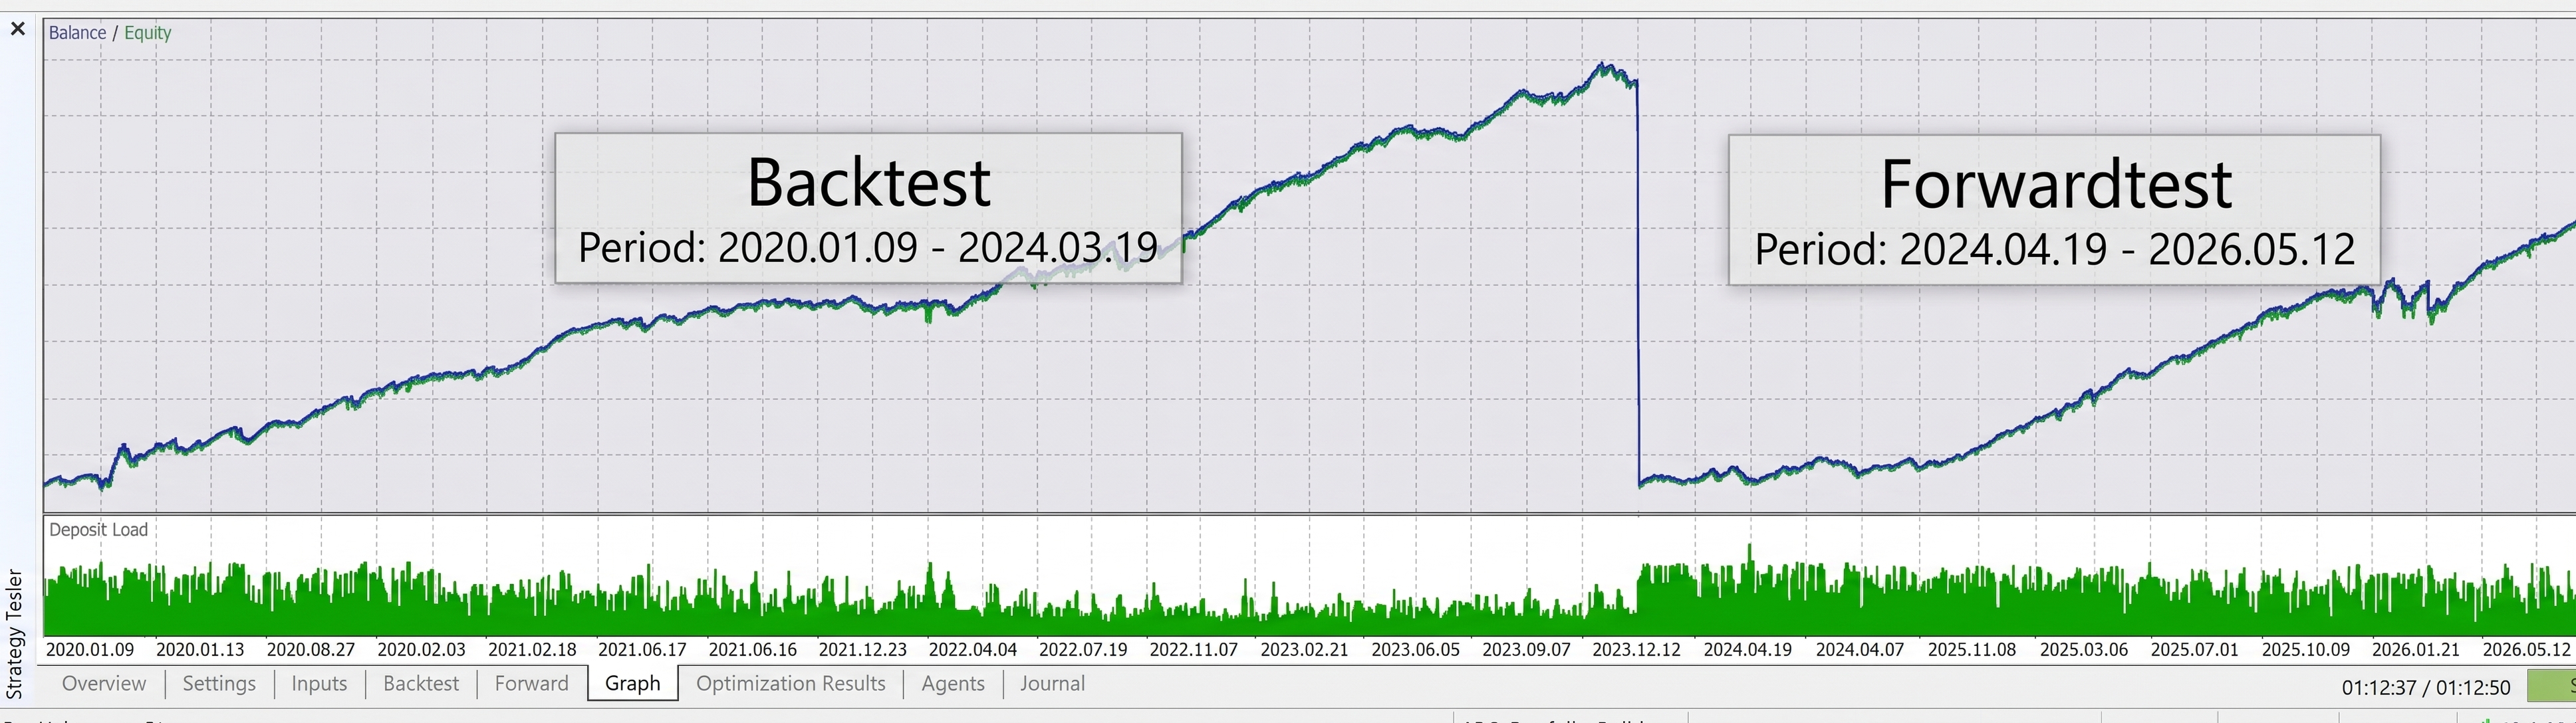
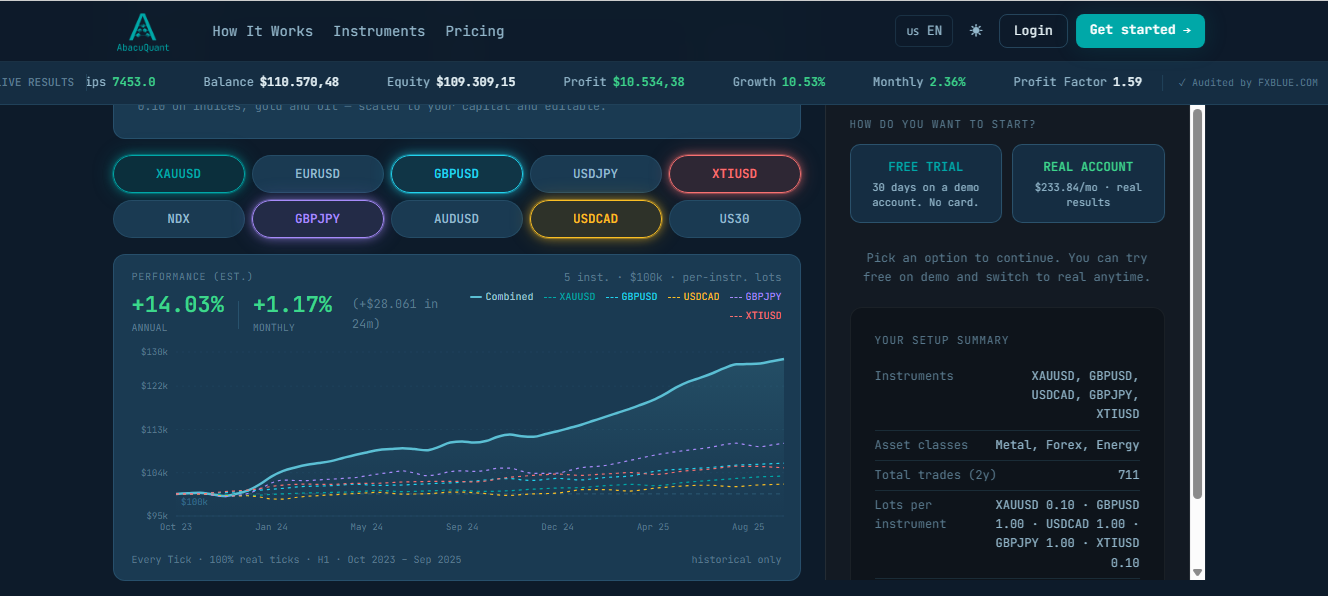
That's the same principle I ended up building AbacuQuant around, just scaled up from one exit rule to an entire portfolio. Instead of one strategy tuned to look good on one backtest, the logic behind each strategy is walk-forward tested and optimized (genetic optimization, not a single curve-fit) across different market regimes and asset classes, forex, metals, indices, energy, ETFs, individual stocks — and then combined into a portfolio specifically to keep cross-asset correlation low (the current version sits under 0.4 correlation across most pairs in the book). The idea isn't "find the one strategy that beats the market." It's "find enough structurally different, regime-validated pieces that the portfolio doesn't fall apart when one regime ends," which is exactly the failure mode people are describing in that XAUUSD thread, just at the position level instead of the portfolio level.

It also runs entirely inside your own MetaTrader account nothing custodial, your funds never move to a third party and the newer version adds the drawdown/consistency rules prop firms check for, since that's become how a lot of people are actually trading it live.

If any of this is useful for how you're thinking about your own trailing logic or portfolio construction, happy to go deeper in the comments. And if you want to see what the regime-validated approach looks like applied across a full portfolio rather than one exit rule, it's at abacuquant.com.

Cristian David Castillo Arrieta
Build your own portfolio and connect it to your demo (free) or live account.

www.abacuquant.com
Cristian David Castillo Arrieta
パブリッシュされたコードExecution Cost Sensitivity Analyzer
戦略の優位性が執行コストに対してどれほど堅牢であるかを測定する、純粋なMQL5スクリプトです。このスクリプトは、決済済み取引の「日付、利益、取引量」を記載したCSVファイルを読み込み、各取引のコストを「固定部分」と「ロット単位の費用」の合計としてモデル化します。 本スクリプトは、取引ごとの損益分岐コスト、クッション(想定される現実的なコストの何倍で純利益がゼロになるかを示す倍率)、想定コストで再評価した純利益と利益率、コストによって勝ちトレードが負けトレードに転じる割合、および推奨事項付きのA+~Fの複合コスト耐性スコアを出力します。 ファイルが存在しない場合は、再現可能なサンプルを生成して分析するため、初回実行時にも出力を確認できます。外部ライブラリ、Python、AIは一切使用していません。
Cristian David Castillo Arrieta
パブリッシュされた記事Beyond Maximum Drawdown: Building a Drawdown DNA Analyzer in MQL5
Beyond Maximum Drawdown: Building a Drawdown DNA Analyzer in MQL5

Maximum drawdown is one number that hides what really matters: how often an equity curve declines, how long it stays below a previous peak, and how quickly it recovers. This article builds a native MQL5 tool that reconstructs the underwater curve, breaks it into individual drawdown episodes (depth, duration, recovery time), computes the Ulcer Index, Pain Index, and Recovery Factor, and combines them into a single resilience grade with practical recommendations. No external libraries, no Python, no AI.

Cristian David Castillo Arrieta パブリッシュされたプロダクト

Funded Trade Manager MT5 Most funded accounts are not lost to a bad strategy. They are lost to a single day that went too far: one oversized position, one revenge trade, one violated daily loss limit. Prop Firm Guard is a chart panel that applies the same limits your funding company applies, before the company does. What it does Tracks your daily loss limit and maximum drawdown in real time, using the same day-reset logic prop firms use (configurable server reset hour). Blocks any new trade

Cristian David Castillo Arrieta
パブリッシュされたコードProfit Concentration Analyzer
戦略の利益がどれほど集中しているか、つまり優位性が広範囲に及んでいるのか、それとも少数の幸運な取引に依存しているのかを測定する、ネイティブのMQL5スクリプトです。このスクリプトは、取引ごとのCSVファイル(日付、利益)を読み込み、最大規模の取引による純利益の割合、 勝ちトレードのジニ係数、集中度プロファイル、上位数件のトレードを除外して純利益と利益率を再計算するサバイバルテスト、および設定可能な一貫性限界値に対する最大単日利益を算出し、これらを「集中度・一貫性スコア」(A+~F)として統合し、推奨事項を提示します。 ファイルが見つからない場合はサンプルセットを生成するため、インストール後すぐに実行可能です。外部ライブラリ、Python、AIは一切不要です。ヘルパーのExportTrades.mq5が、取引履歴からファイルを書き出します。
Cristian David Castillo Arrieta
パブリッシュされたコードDrawdown DNA Analyzer
単なる「最大ドローダウン」という数値だけでなく、口座のドローダウンの構造を分析するネイティブのMQL5スクリプトです。日次のエクイティカーブ(Date,DailyPnL CSV)を読み込み、アンダーウォーターカーブを再構築し、それを個々のドローダウンエピソードに分割して、その深さ、継続期間、回復時間を算出します。 その後、「ウルサー指数」、「ペイン指数」、「回復係数」、およびアンダーウォーター状態の継続時間を算出し、これらを組み合わせて単一のレジリエンススコア(A+~F)と推奨事項を生成し、「エキスパート」タブに表示します。外部ライブラリは不要です。ファイルが見つからない場合はサンプルカーブを生成するため、インストール後すぐに実行可能です。
Cristian David Castillo Arrieta
Introduction: The Context-Blind Expert Advisor Problem A carefully optimized Expert Advisor completes six months of profitable forward testing. The equity curve is smooth, the drawdown is bounded, and the trade distribution looks healthy. On the first Friday of the seventh month, the EA opens a 0...
Cristian David Castillo Arrieta
パブリッシュされた記事Building a Correlation-Aware Multi-EA Portfolio Scorer in MQL5
Building a Correlation-Aware Multi-EA Portfolio Scorer in MQL5

Most algo traders optimize Expert Advisors individually but never measure how they behave together on a single account. Correlated strategies amplify drawdowns instead of reducing them, and coverage gaps leave portfolios blind during entire trading sessions. This article builds a complete portfolio scorer in MQL5 that reads daily P&L from backtest CSV files, computes a full Pearson correlation matrix, maps trading activity by hour and weekday, evaluates asset class diversity, and outputs a composite grade from A+ to F. All source code is included; no external libraries are required.

1
Cristian David Castillo Arrieta パブリッシュされたプロダクト

ABQ Portfolio Correlation Scorer: Inteligencia Artificial de Grado Institucional para la Gestión de Riesgo La mayoría de los traders no fracasan por una mala estrategia de entrada, sino por una falla invisible en la arquitectura de su portafolio . El error más común es la sobreexposición por correlación: abrir múltiples posiciones pensando que se está diversificando, cuando en realidad se está multiplicando el riesgo sobre un mismo factor. ABQ Portfolio Correlation Scorer es un Copiloto de

Cristian David Castillo Arrieta
ABQ Visual Risk Sizer - Official User Manual Author: Cristian Castillo | AbacuQuant Version: 1.60 Platform: MetaTrader 5 (MT5...
Cristian David Castillo Arrieta パブリッシュされたプロダクト

ABQ Visual Risk Sizer - Institutional Risk & Trade Execution カテゴリ:ユーティリティ / リスク管理 手動によるロット計算は、時間とコストの浪費につながります。 現代のトレーディング、特にプロップファーム(Prop Firms)の口座を運用する場合、ロット計算の誤りや注文入力のわずか5秒の遅れが、デイリードローダウンルールの違反や絶好のエントリーポイントを逃す原因となります。 ABQ Visual Risk Sizer は、この問題を根本的に解決するために設計された機関投資家レベルのツールです。複雑なリスクの数学的計算を、MetaTrader 5のチャート上で直接、直感的かつ迅速、そして100%正確な視覚的体験へと変貌させます。 外部のカレンダ計算機やExcelシートはもう必要ありません。チャート上のラインをドラッグするだけで、ワンクリックで取引を実行できます。 ABQ Visual Risk Sizer が必要な理由 プロップファームのための完全保護:

Cristian David Castillo Arrieta
パブリッシュされたコードPortfolio Scorer — Multi-EA Correlation and Coverage Analyzer
Portfolio Scorer is a standalone MQL5 script that evaluates the quality of a multi-EA portfolio across three critical dimensions that most algo traders overlook. The script reads daily profit and loss data from CSV files (one per Expert Advisor), computes a full Pearson correlation matrix between every strategy pair, maps trading activity by UTC hour and weekday, detects asset class diversity, and produces a weighted composite score with a letter grade from A+ to F. How it works: The tool runs in four sequential stages. First, the Data Loader reads and validates CSV files containing daily returns for each EA in the portfolio. Second, the Correlation Engine calculates the complete NxN Pearson correlation matrix and flags pairs that exceed a configurable threshold. Third, the Coverage Analyzer maps which hours and weekdays have active trading and identifies blind spots. Fourth, the Scoring Function combines all three dimensions into a single composite score using adjustable weights.
1 168
Cristian David Castillo Arrieta
It was late 2022. I had spent six months building what I believed was the perfect Expert Advisor. The backtest was gorgeous: Profit Factor 3.2, maximum drawdown under 5%, a Sharpe ratio that would make a hedge fund manager jealous . I had optimized every parameter. Every indicator period...
123