Abacuquant Portfolio
- Experts
-
Cristian David Castillo Arrieta
 Finance and International Business professional with a specialization in Financial Management. Self-taught MQL5 and Python developer focused on algorithmic trading, multi-asset portfolio construction, and quantitative risk management.
 - Version: 1.10
- Updated: 3 October 2026
- Activations: 10
Thirty-nine markets were researched for this Expert Advisor. Twenty-two were rejected. Eleven made it in.
AbacuQuant Portfolio trades the eleven that passed: three currency majors, the euro-yen cross, gold, and six stock indices that follow the trading day from Tokyo and Sydney to London, Frankfurt and New York. One H1 chart. Seventy-one independent configurations. One risk engine that measures the whole account, not one trade at a time.
Every market was put through the same research process, and that process turned down most of what it tested. That ratio is the first thing worth knowing about this product. A process that rejects more than it accepts is not built to produce an attractive backtest. It is built to keep out what does not hold up.
What you get
- Eleven validated presets, ready to run. EURUSD, USDJPY, AUDUSD, EURJPY, XAUUSD, Dow Jones (WS30), Nasdaq 100 (NDX), Nikkei 225 (NI225), Australia 200 (AUS200), Euro Stoxx 50 (STOXX50E) and FTSE 100 (UK100). No optimization is required before use.
- One chart for everything. Attach the EA to a single H1 chart. It manages every market you enable.
- Risk measured at account level. Each position is sized from its own stop distance, and three global ceilings limit total open risk, margin use and equity drawdown across all markets together.
- No martingale, no grid, no averaging, no recovery logic. Every position opens with its stop loss and take profit already attached to the order.
- A complete research framework. Manual mode gives you the same engine to build and test your own configurations.
The markets that did not make it
The rejections are part of the product, because they show what the acceptance procedure actually does.
- S&P 500. Passed the statistical screening, then failed the real-tick test. Its win rate barely cleared its own break-even level (t = 0.53).
- Crude oil. Showed the strongest agreement between the selection period and the later period of any market in the research (rank correlation +0.60), and still failed the real-tick test with a negative margin. A good-looking history was not enough.
- DAX, CAC 40 and IBEX 35. All three failed the real-tick test (t = 0.34, -0.85 and 0.16).
- AUDJPY. Missed the correlation threshold by 0.004. It was rejected anyway. The threshold is not adjusted to let a market in.
- USDCAD, USDCHF, NZDUSD, GBPJPY, silver and natural gas. Rejected at the statistical screening or in real ticks.
- Ten individual US stocks, including Apple, Microsoft, Visa and Coca-Cola. In every case, ranking configurations by their past results did not reliably predict the later results, and in several it pointed the wrong way. They were rejected before any preset was built.
Every rejected market that reached the real-tick stage remains inside the code as a preset, switched off and labelled, so you can open it in the Strategy Tester and see why it failed.
Six more markets are in the code but switched off while their validation is completed. Five US stocks (Boeing, Chevron, Exxon Mobil, Home Depot and Disney) passed the first stage and await their real-tick test. GBPUSD passed its real-tick test with a wide margin, but on 18 losses, below the 40 the procedure requires, so it stays off until a rebuilt preset meets that standard. Each will be added as a validated preset only if it passes.
The eleven accepted markets
The acceptance procedure has three conditions, measured on a stand-alone test of each preset with real tick data. Losing trades must close at their stop, at least 95 percent of the time, so that the stop was really tested. The win rate must sit above the break-even level implied by its own stop and target, by a margin unlikely to be chance (t of 2 or more). And the result must rest on at least 40 observed losses, because a record built on a handful of losses is not measured, it is guessed. All eleven presets meet all three conditions in the exact version shipped in the EA.
| Market | Configurations | Margin over break-even | t | Losses observed |
| AUDUSD | 8 | +8.17 | 4.88 | 83 |
| USDJPY | 6 | +7.24 | 4.19 | 80 |
| Euro Stoxx 50 | 6 | +8.53 | 4.12 | 58 |
| EURUSD | 8 | +4.24 | 3.56 | 42 |
| Dow Jones | 9 | +6.03 | 3.50 | 127 |
| Australia 200 | 3 | +8.52 | 3.06 | 66 |
| FTSE 100 | 7 | +6.36 | 3.04 | 81 |
| Nikkei 225 (*) | 8 | +5.22 | 2.63 | 84 |
| Nasdaq 100 | 4 | +6.37 | 2.33 | 71 |
| XAUUSD | 7 | +4.41 | 2.27 | 123 |
| EURJPY | 5 | +6.62 | 2.21 | 72 |
Margin is how far the win rate sat above its own break-even line, in percentage points. t expresses that margin in standard errors. The table runs from the largest t to the one closest to the threshold. Gold, the Nasdaq and the euro-yen cross passed with the least room, and they are shown that way rather than averaged into the others.
(*) For the Nikkei 225, the validation broker supplied real ticks for about half of the test history. The Strategy Tester modelled the rest.
Why eleven markets instead of one
A single strategy on a single market spends most of its time waiting, and when that market changes character, everything it holds changes with it. This portfolio spreads its decisions across asset classes and across the trading day: Asian indices during the Tokyo and Sydney sessions, European indices and currencies through London and Frankfurt, US indices into the New York afternoon, with gold and the majors in between. The losing periods of different markets do not always arrive at the same time.
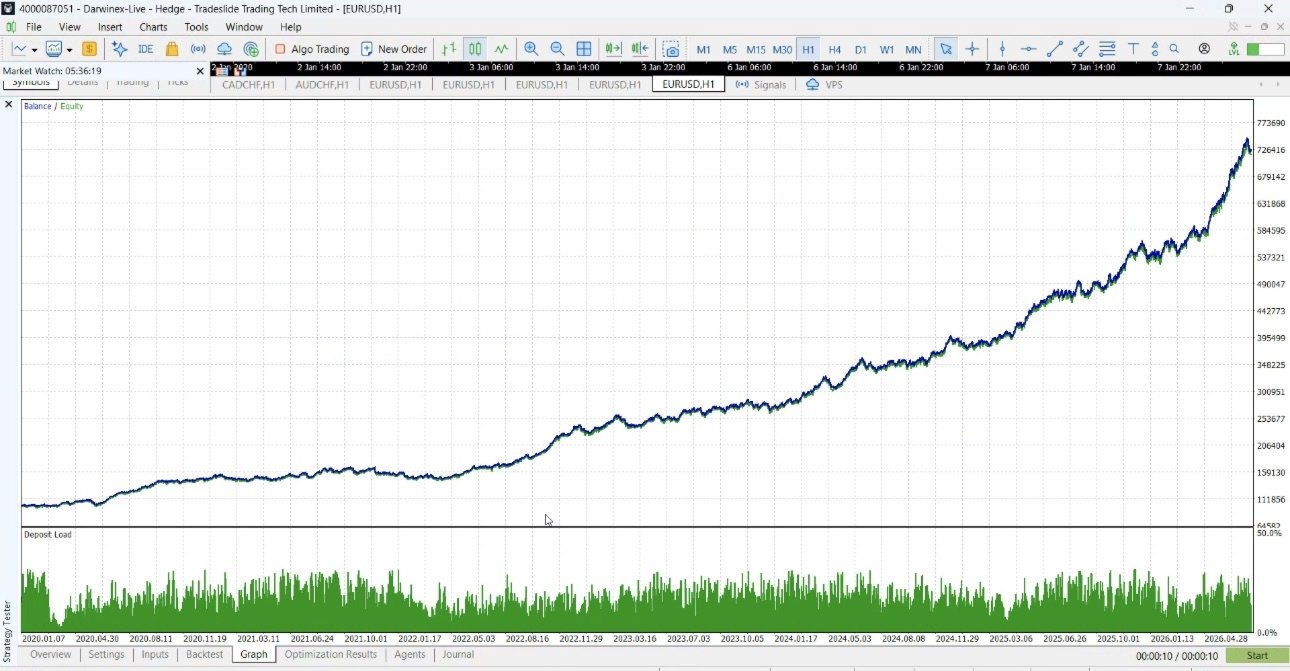
All eleven presets were run together on one account, at the default settings, over the most recent period of the research, May 2024 to July 2026, in the Strategy Tester with real ticks:
- 3,849 trades, 79 percent closed in profit, 790 losses.
- Profit factor 1.38.
- 24 of 27 calendar months ended positive.
- All eleven markets contributed positively, and no single market contributed more than 14 percent of the result.
- The deepest decline from an equity peak was 6.3 percent, and the worst calendar month was -4.6 percent.
These are Strategy Tester results on historical data, not live trading results. Losses grow with the risk setting: an earlier run of the portfolio at 2 percent per trade, four times the default, declined 22 percent from its equity peak.
How a trade is decided
- The configuration must be active. Each one trades only inside its own window, set to the minute.
- The candle must be closed. Signals use completed H1 bars only, so the logic behaves the same in the Strategy Tester and in live trading.
- Several signals must agree. Each configuration combines components such as order-flow imbalance, Fibonacci breaks, candlestick patterns, support and resistance, Bollinger Bands, RSI, moving averages, MACD, ADX and Stochastic, with its own agreement threshold. One indicator alone never opens a trade.
- The stop comes first. The stop distance is set from current volatility (ATR), and the position size is calculated from that distance so the money at risk matches your setting. A wider stop gives a smaller position.
- The account is checked. Before sending an order, the EA checks total open risk, margin use and equity drawdown across every market. Any one of them can refuse the trade, and a refusal is treated as an acceptable outcome.
- Protection travels with the order. Stop loss and take profit are part of the opening instruction, not added afterwards. If the connection drops, the protection is already on the broker's server.
- Nothing tries to win back a loss. No added positions, no moved stops, no re-entry to recover.
Risk control, layer by layer
- Per trade. Size follows the stop distance and your risk percentage, 0.5 percent by default, using the broker's own contract specifications. Double the balance and positions double; halve it and they halve.
- Per configuration. Each configuration has its own trading window and its own limit on open positions.
- Per account. Three global ceilings, all set to 30 percent by default: total open risk if every stop were hit at once, margin committed, and decline from the equity peak, which closes everything when reached. A limit of 10 open positions applies across the whole portfolio. These limits are measured across every market and chart the EA manages, so running eleven markets does not multiply your permitted exposure by eleven.
- Broker reality. When the broker's minimum lot would risk more than your setting, the EA detects it, reports the balance that configuration needs, and with SkipTradeIfMinLotExceedsRisk enabled refuses the trade instead of exceeding your limit.
Configurations on the same market are independent of each other, so at times two of them hold positions in the same direction. That behaviour is included in every test result quoted here, and the global ceilings cap the total.
Understand the trade-off
The presets use volatility-based stops that are usually wider than their targets. That produces a specific trade distribution: a high share of winning trades, winners that are individually small, and losing trades that are larger. How much larger depends on the market.
- In most markets, a configuration needs to win roughly 50 to 80 percent of its trades to break even, so a typical loss equals one to four typical wins.
- EURUSD, the oldest preset, uses very wide stops with close targets in several configurations. Their break-even win rates reach the 90s, and one loss can equal ten or more typical wins. They pass because their win rates are correspondingly higher.
- Across the combined test, the average loss was about 2.8 times the average win.
You will see those losses. They are part of the design, not a malfunction, and they are already inside every figure in this description. If your aim is an equity curve with no visible losses, this is not that kind of system.
What this EA does not do
- No martingale. Position size never increases after a loss.
- No grid. Losing positions are not followed by additional positions.
- No averaging down.
- No trade without a stop loss.
- No repainting. Decisions use completed bars only.
How the presets were built and tested
- Search. For each market, a genetic optimization over roughly 100,000 to 340,000 parameter sets on H1, using January 2020 to May 2024 for selection and May 2024 to August 2026 as a second period.
- Statistical screening. Before building anything, the research asked whether ranking configurations by the first period predicts the second. Markets where it does not (ratio below 1, or rank correlation below +0.10) were rejected at this stage, whatever their best results looked like.
- Geometry filter. Configurations whose break-even win rate exceeds 80 percent were excluded (85 percent for gold and AUDUSD). EURUSD predates this filter.
- Non-overlapping windows. Within each market, configurations were chosen so their trading windows do not overlap.
- Stand-alone real-tick test. Each preset alone, with "Every tick based on real ticks", against the three acceptance conditions.
- Combined portfolio test. All accepted presets together on one account, at the default settings, with the global risk ceilings active.
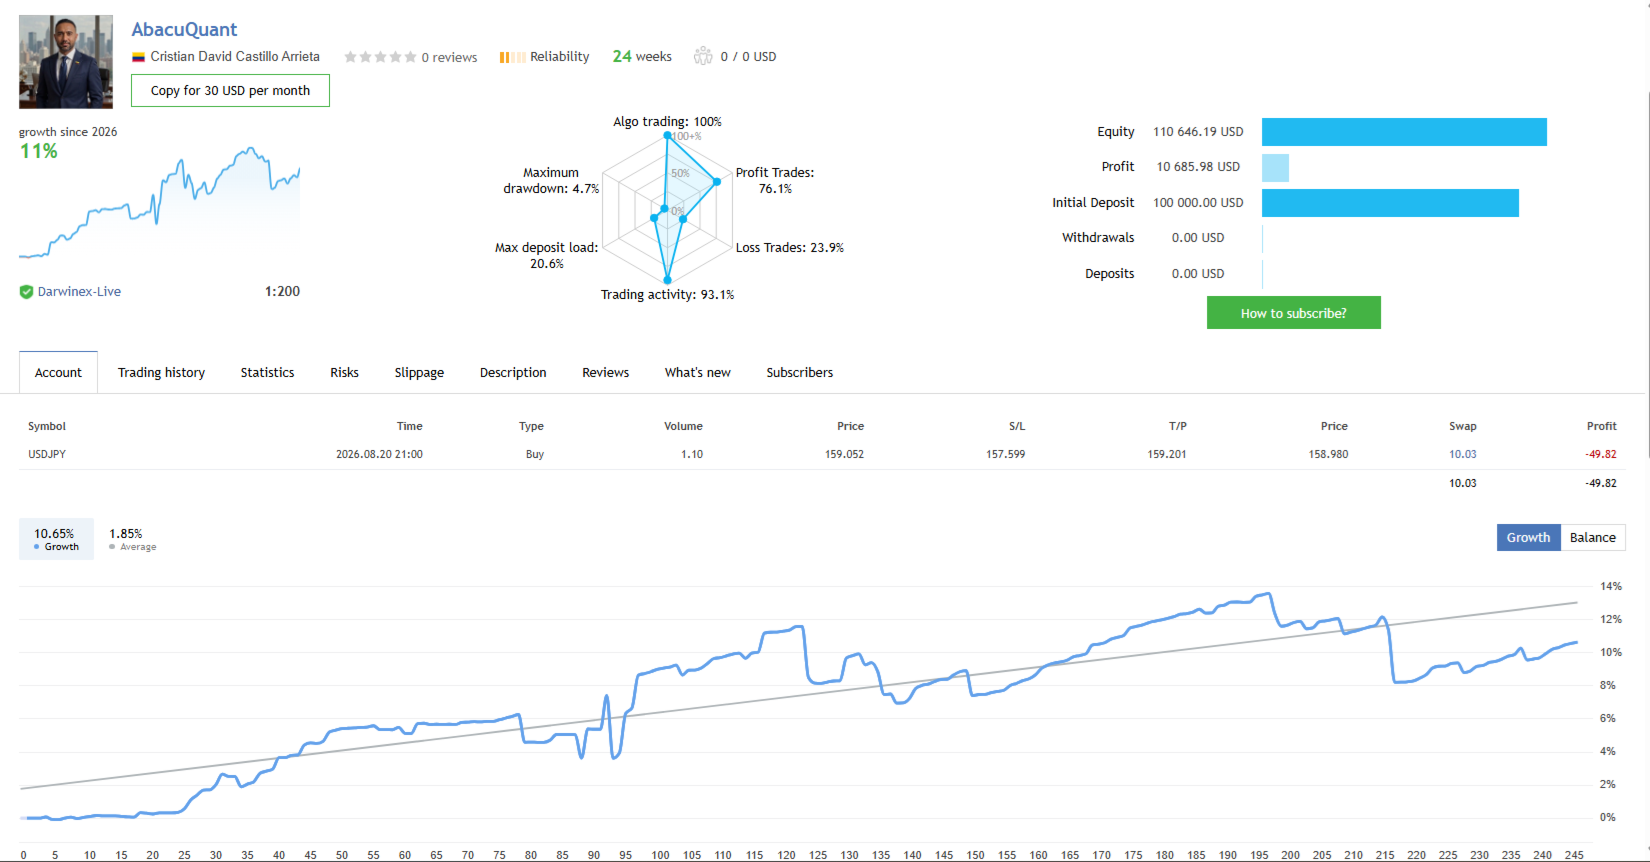
A point of method, stated plainly: the second period was also used as a consistency requirement when choosing configurations, so its figures describe consistency rather than a blind test. The stronger checks are that one research process was applied to thirty-nine markets and rejected twenty-two of them, and that the same engine has been running on the developer's own real-money account since August 2026.
Manual mode and the custom criterion
The validated presets are one way to use the engine. Manual mode exposes the same framework: which components are active, how many must agree, the trading window to the minute, indicator periods, allowed direction, maximum positions, ATR-based stop and target, and the sizing method (risk based, fixed lot or proportional). Choosing your own sizing changes the method, not the safety limits.
The EA also includes a custom optimization criterion. It does not rank by net profit. It measures how far the win rate sits above the break-even level implied by the stop and target, and rejects results built on too few losses. A very distant stop with a very close target can produce a smooth curve simply because the stop was rarely reached inside the test window. This criterion is designed to push those configurations down the list. Select Custom max in the Strategy Tester to use it.
Account size
Every broker enforces a minimum lot. On a small account, that minimum can risk more than your percentage asks for. Measured from the validation runs at the default 0.5 percent, sizing works properly from approximately:
- The three majors only: about 3,000.
- Adding gold, EURJPY and the indices except the Nikkei: about 8,000.
- All eleven markets: about 20,000. The Nikkei is the limiting market because of its larger lot step at the validation broker.
Below these levels the EA still trades, but real risk per trade can exceed your setting. The EA prints the balance each configuration needs at startup, and the free demo shows it before you rent. Cent accounts, where available, allow finer sizing on small balances without changing any setting.
Requirements and setup
- MetaTrader 5 and a hedging account. The presets keep independent positions on the same instrument, each with its own stop. A netting account merges them and the presets will not behave as validated.
- An H1 chart. One chart manages every enabled market.
- A broker offering the markets you enable. Index names vary between brokers; the EA resolves common names automatically and accepts explicit symbol mapping.
- Broker server time. The validation used GMT+2 in winter and GMT+3 in summer. If your broker differs, enter its winter offset in the inputs. The offset and the resulting adjustment are printed in the Experts log at startup.
- A VPS is recommended for continuous operation.
Setup takes three steps: attach the EA to an H1 chart, choose the markets and risk, and check the server-time line in the Experts log. If something is wrong, the EA says so in plain language rather than failing silently. An on-chart panel shows live status.
Test it before you rent
Download the free demo and run it in the MetaTrader 5 Strategy Tester on H1 with "Every tick based on real ticks". Set the deposit to the amount you actually intend to trade. You can inspect every trade: where stops and targets are placed, how size changes with stop distance, how the global limits refuse entries, and how losses look next to wins.
Pay particular attention to the losing trades. If that distribution does not suit the risk you are willing to accept, it is better to find out in the Strategy Tester than with real money.
Included with your rental
- Direct support from the developer in English and Spanish through MQL5 messages and the comments section.
- Help with installation, broker configuration, symbol mapping, server time and risk settings.
- A clear answer when a configuration is not suitable for your account or broker.
- All updates while your rental is active, including new markets that pass the same acceptance procedure.
Honest limitations
- This is not a set-and-forget product. Markets change, and presets are reviewed as part of the update stream.
- Trading is not continuous. Configurations act only inside their windows, so quiet periods are normal.
- Index contracts differ between brokers more than currency pairs do, in contract size, lot step and trading hours. Verify the index presets on your broker in the demo before trading them.
- Every figure here was measured on historical data, at one broker, with one clock setting. It describes what happened, not what will happen.
- No Expert Advisor can guarantee profit or remove the risk of loss.
Trading involves risk of loss. Use only capital you can afford to lose, and evaluate the EA under the broker, account size and conditions you actually intend to use.