Cristian David Castillo Arrieta / 个人资料
- 信息
|
2 年
经验
|
4
产品
|
100
演示版
|
|
0
工作
|
1
信号
|
0
订阅者
|
我的工作核心是设计、优化和验证作为协调组合运行的智能交易系统,而非孤立的策略。我运用相关性分析、时间覆盖映射和资产类别多元化来构建不依赖于单一工具或单一方法的交易系统。
目前,我管理着涵盖外汇、指数、贵金属、能源和美国股票的算法投资组合,同时在多个交易时段和时间框架上运行。
我通过技术文章和开源工具在这个社区分享我的经验。我相信,从"构建单个EA"到"工程化投资组合"的转变,是区分散户思维与机构思维的关键,这一理念指导着我在这里发布的所有内容。
Crude oil, the S&P 500, the DAX, ten US stocks. Some looked great on paper, then failed the real-tick test or the statistical screening. AUDJPY missed one threshold by 0.004 and was rejected anyway. The rules don't bend to let a market in.
That's the point. Many EAs are sold on the best backtest that could be found. This one is built from what survived a process designed to say no.
What made it in:
• 11 validated markets: EURUSD, USDJPY, AUDUSD, EURJPY, gold and six indices (Dow Jones, Nasdaq 100, Nikkei 225, Australia 200, Euro Stoxx 50, FTSE 100)
• 71 independent configurations running from one H1 chart
• Account-level risk control: global limits on total open risk, margin and equity drawdown across every market
• Stop loss and take profit attached to every order. No martingale, no grid, no averaging, no recovery logic
The numbers (Strategy Tester, real ticks, 0.5% risk per trade, Jan 2020 – Jul 2026):
• 11,333 trades, 80.3% win rate
• Deepest equity decline: 6.4%
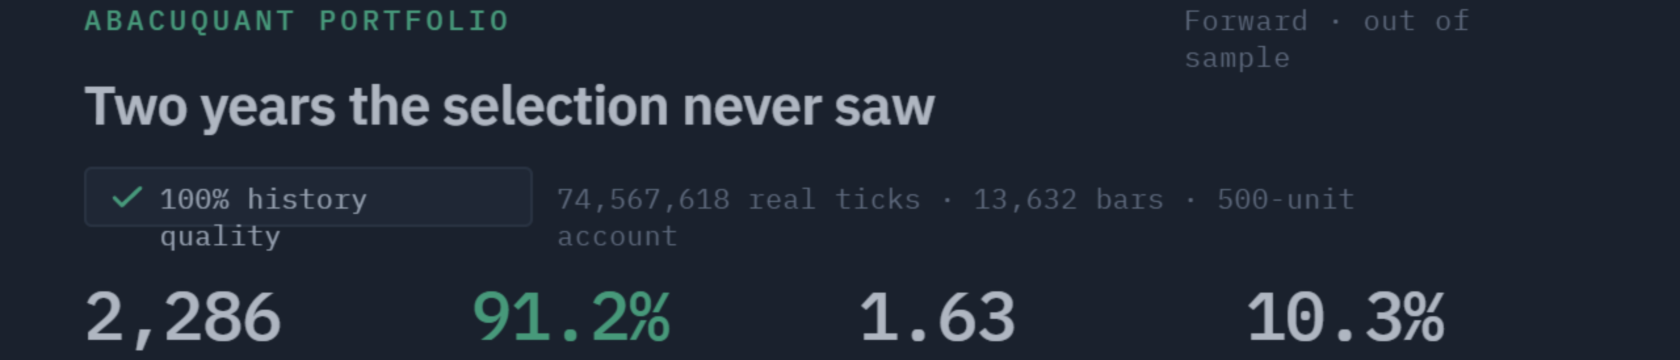
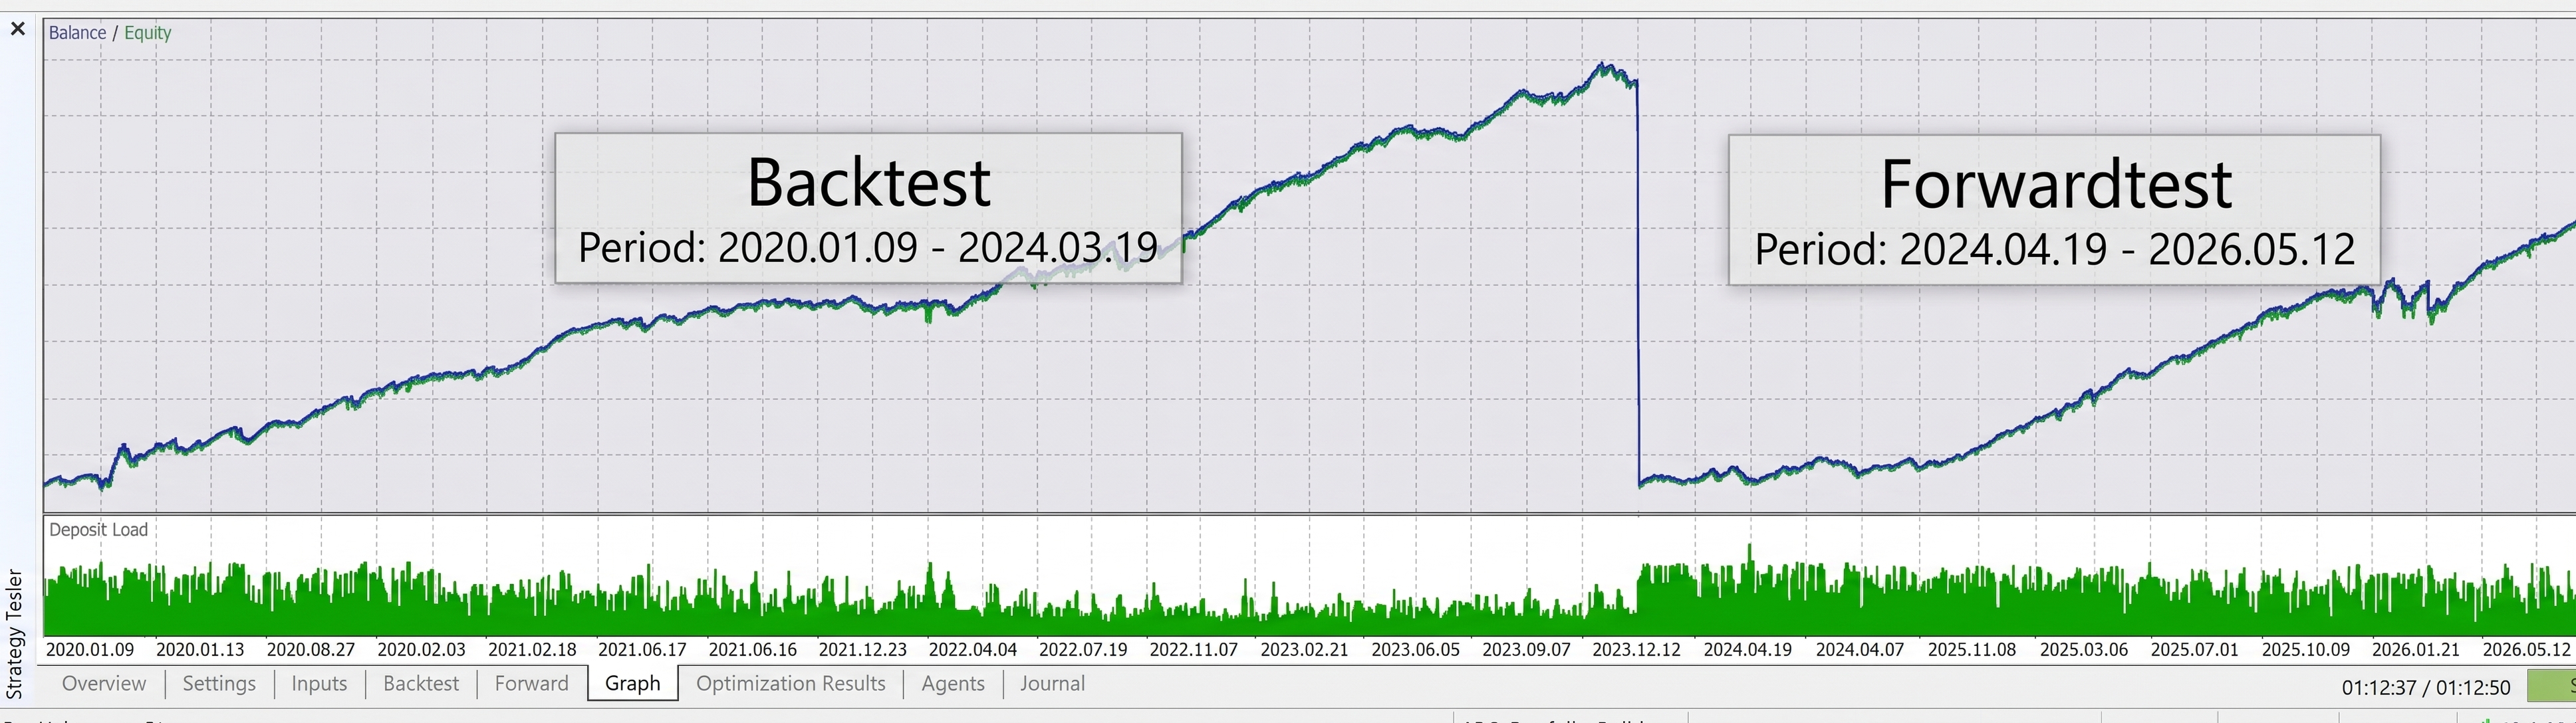
• Most recent period (May 2024 – Jul 2026): profit factor 1.38, 24 of 27 months positive, all 11 markets in profit, none above 14% of the total
The trade-off, stated plainly: the average loss is about 2.8x the average win. You will see losing trades. If you want an equity curve with no visible losses, this is not your EA.
Why test it: the demo is free. Run it with "Every tick based on real ticks", on your own broker, with the balance you actually plan to trade. The EA tells you at startup what balance each configuration needs. Look closely at the losing trades.
Why get the full version: it's a research framework, not just a set of presets. Manual mode gives you the same engine, and a custom optimization criterion ranks results by the win rate's margin over its own break-even level instead of net profit. New markets are added only if they pass the same tests, and you get direct support from me in English and Spanish. I have been running this engine on my own real-money account since August 2026.
Free demo, full methodology and pricing (rental from 49 USD/month):
https://www.mql5.com/en/market/product/191885
Backtests describe the past, not the future. Trading involves risk of loss.
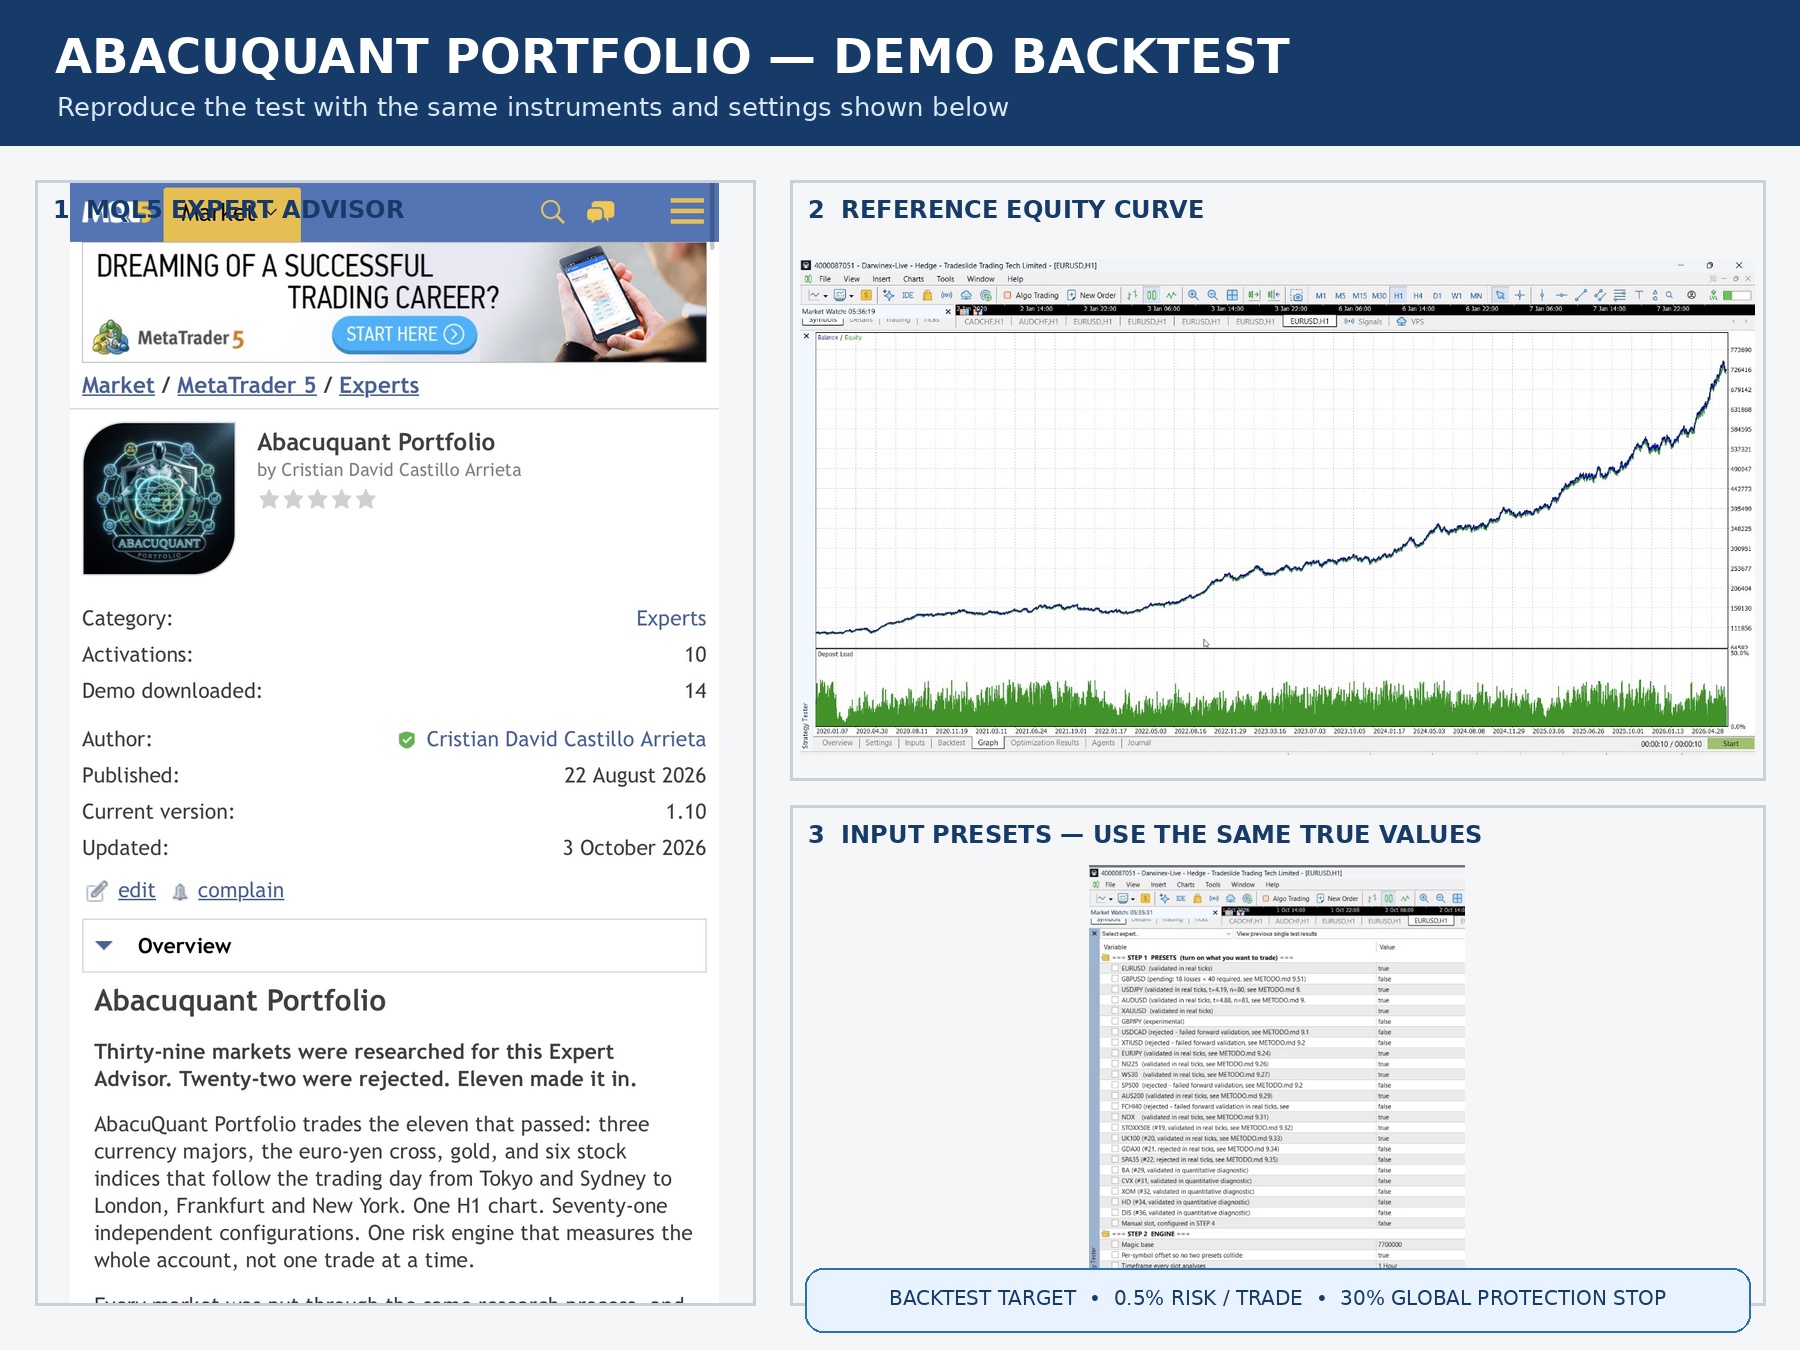
I’m sharing the backtest setup I used with AbacuQuant Portfolio so anyone can download the demo and try to reproduce the results independently.
You can test the instruments one by one if you want to analyze each market separately.
However, if you want to reproduce the portfolio configuration shown in the backtest, set the following instruments to TRUE:
* EURUSD
* USDJPY
* AUDUSD
* XAUUSD
* EURJPY
* N225
* WS30
* NDX
* STOXX50
* UK100
All other instrument presets should remain FALSE.
Risk settings used
Risk per trade: 0.5%
General protection stop: 30%
The idea is simple: don’t just look at the equity curve — download the demo and test it yourself.
Use the same instruments and settings shown above and see what results you get on your own MT5 environment.
Different brokers, spreads, commissions and execution conditions can affect the results, so your backtest may not be identical to mine.
I would actually encourage you to challenge the results.
Test the instruments individually. Test the portfolio. Change the parameters. Stress-test it.
The goal of AbacuQuant Portfolio is not to ask you to blindly trust a backtest.
It’s to give you something you can test for yourself.
👉 Download the demo and start your own backtest.
AbacuQuant Portfolio — available on MQL5.
Aggregate metrics like win rate or profit factor miss sequence-dependent behavior, such as sizing up right after a loss. This MQL5 script trains a small native neural network on closed-deal history to estimate loss probability from behavioral and market-context features. It reports accuracy uplift over a baseline, probability calibration, and permutation feature importance, then combines them into a configurable A-F grade with concise, plain-language recommendations.
The article presents an MQL5 tool that tests whether scaling out improved results rather than only appearing disciplined. It reconstructs positions from closing-deal history and reprices the full volume at the first, last, and best exit rates actually achieved, producing a Value-Add Ratio, a Scale-Out Win Rate, and an Efficiency measure. A single-trade dependence check and a configurable A+ to F grade turn these into clear, decision-ready feedback.
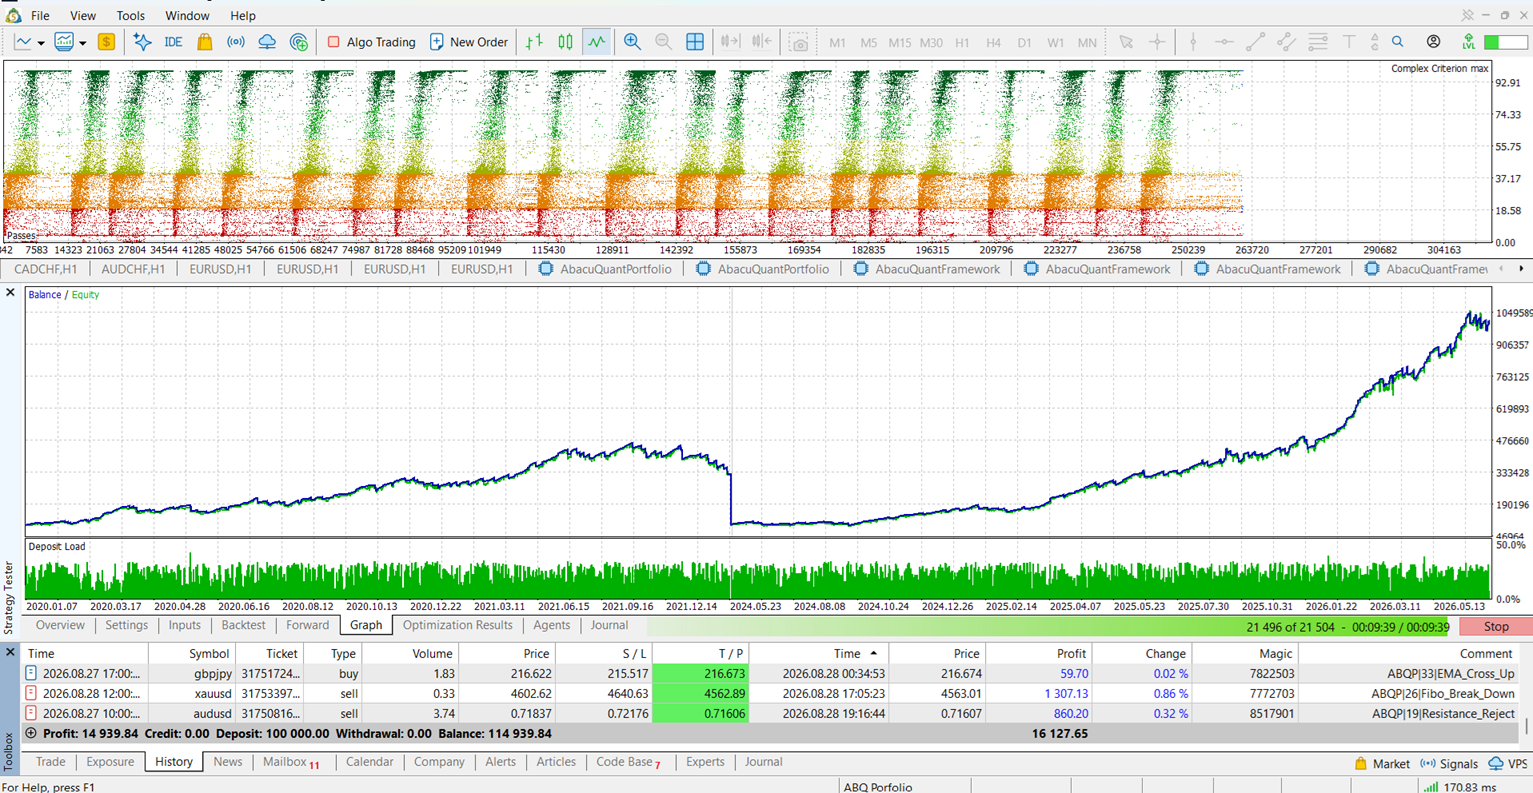
What makes this interesting is that this is not a single strategy being optimized over and over. AbacuQuant Portfolio is designed as a portfolio engine, capable of running multiple independent configurations across different instruments and market conditions from a single MT5 chart.
The process starts by testing different combinations of strategies, trading conditions, parameters, stop/target structures and risk settings. Instead of simply looking for the configuration with the highest profit, AbacuQuant uses a custom optimization criterion designed to evaluate whether the historical win rate provides a meaningful margin above the break-even level implied by the stop and target structure.
The resulting configurations are then combined into a portfolio, allowing different strategies and instruments to operate during different market sessions while a shared risk engine controls total exposure at the account level.
The objective is not to find one “perfect” setup. It is to build a collection of independent configurations that complement each other and create a more robust portfolio.
This image shows one of those optimization and portfolio-development results. The robot used to generate it is the AbacuQuant Portfolio EA.
🔗 https://www.mql5.com/en/market/product/191885
Why it's different
Most EAs run one strategy with one set of parameters on one instrument. This one runs up to 48 independent configurations at once, across EURUSD, GBPUSD, USDJPY and AUDUSD, from a single chart. Each configuration owns its own trading hours, its own combination of ten built-in strategies, and its own ATR-based stop and target. A configuration built for the London session simply doesn't trade outside it — and risk is measured across the whole account, not per configuration, so running four instruments together doesn't quietly multiply your exposure.
And it's built the honest way: no martingale, no grid, no averaging into a losing position, no hidden loss-recovery logic. Every stop is attached the moment the trade opens. If you've been burned by an EA with a beautiful equity curve that fell apart the first time the market disagreed with it, this was built specifically against that failure mode.
How it decides a trade
Each active configuration waits for its window, reads only completed H1 bars (never the forming candle), requires several of its enabled strategies to agree, and sizes the position from the stop distance rather than a fixed lot — so a wider stop always means a smaller position, and the money at risk stays constant. Every configuration passed the same acceptance procedure on real-tick data before it shipped: statistical significance over its own break-even line, a minimum number of losing trades to actually measure it, and stops that were genuinely reached rather than just theorized.
Try it before you take my word for it
The demo runs in full inside the Strategy Tester — same presets, same logic, no time limit. Turn on the validated instruments, select "Every tick based on real ticks," and look at the trade list yourself: the stops, the position sizing, the risk ceilings holding across instruments. I'd rather you find out in the tester, for free, than after committing real money.
Link to the product page: https://www.mql5.com/en/market/product/191885
为这款 EA 我们研究了 39 个市场。其中 22 个被淘汰,11 个最终入选。 AbacuQuant Portfolio 交易通过检验的 11 个市场:三个主要货币对、欧元兑日元交叉盘、黄金,以及六个股票指数。这些指数跟随交易日从东京和悉尼一直延伸到伦敦、法兰克福和纽约。一个 H1 图表。71 个独立配置。一个风险引擎衡量整个账户,而不是一次只看一笔交易。 每个市场都经过同一套研究流程,而这套流程淘汰了它所检验的大部分内容。这个比例是了解本产品时首先值得知道的事情。一个淘汰多于接受的流程,并不是为了做出一份好看的回测而设计的。它是为了把站不住脚的东西挡在门外。 您将获得 11 个经过验证、可直接使用的预设。 EURUSD、USDJPY、AUDUSD、EURJPY、XAUUSD、道琼斯 (WS30)、纳斯达克 100 (NDX)、日经 225 (NI225)、澳大利亚 200 (AUS200)、欧洲斯托克 50 (STOXX50E) 和富时 100 (UK100)。使用前无需任何优化。 一个图表管理全部。 将 EA 加载到一个 H1 图表上,它会管理您启用的所有市场。
Aggregate metrics alone do not reveal how a trade sequence manages risk. This MQL5 tool analyzes closed positions to flag four structural patterns: post-loss volume escalation, overlapping same-direction entries, asymmetric payoffs, and a classical risk-of-ruin figure. The results are merged into a configurable A-F grade with concise recommendations to guide further review.
Backtests often understate spread, commission, and slippage. This MQL5 analyzer loads closing deals and simulates rising execution costs to measure robustness. It computes the breakeven cost per deal, the cushion over an assumed cost, the net profit and profit factor at that cost, and how many winners turn into losers, then summarizes the result with an A+ to F grade and targeted guidance.
Net profit and win rate tell you how much a strategy made, not how the result is distributed. This article builds a native MQL5 script that reads your closed trades and measures profit concentration: the top-N trade share, the Gini coefficient of the winners, an outlier-dependence stress test that removes the best few winners, and the largest day against a prop-firm consistency limit. It combines these into one A+ to F score with recommendations, running inside MetaTrader 5.
I was in a forum thread today about trailing stops on XAUUSD, and it made me put into words something I've been building my whole approach around for a while: almost every trailing method traders compare — EMA cross, Chandelier, ATR multiples, swing-structure trails — gets judged on a single backtest run over one continuous chunk of history. The "best" multiplier or ladder step that wins that test isn't actually the best method. It's the method that happened to fit whatever mix of trend and chop was sitting in that sample.
The fix I use is simple to describe and annoying to implement properly: split the history into volatility regimes first (I use ATR percentile over a rolling window, expansion vs. compression), then optimize and validate each piece of logic separately per regime instead of once over the whole dataset. A structural trail wins clearly in expansion. In compression it just gets chopped up by noise, and something tighter does better there. Neither method is "the winner" — the regime decides which one applies.
That's the same principle I ended up building AbacuQuant around, just scaled up from one exit rule to an entire portfolio. Instead of one strategy tuned to look good on one backtest, the logic behind each strategy is walk-forward tested and optimized (genetic optimization, not a single curve-fit) across different market regimes and asset classes, forex, metals, indices, energy, ETFs, individual stocks — and then combined into a portfolio specifically to keep cross-asset correlation low (the current version sits under 0.4 correlation across most pairs in the book). The idea isn't "find the one strategy that beats the market." It's "find enough structurally different, regime-validated pieces that the portfolio doesn't fall apart when one regime ends," which is exactly the failure mode people are describing in that XAUUSD thread, just at the position level instead of the portfolio level.
It also runs entirely inside your own MetaTrader account nothing custodial, your funds never move to a third party and the newer version adds the drawdown/consistency rules prop firms check for, since that's become how a lot of people are actually trading it live.
If any of this is useful for how you're thinking about your own trailing logic or portfolio construction, happy to go deeper in the comments. And if you want to see what the regime-validated approach looks like applied across a full portfolio rather than one exit rule, it's at abacuquant.com.
Cristian David Castillo Arrieta