Cristian David Castillo Arrieta / Perfil
- Información
|
2 años
experiencia
|
3
productos
|
128
versiones demo
|
|
0
trabajos
|
1
señales
|
0
suscriptores
|
Mi trabajo se centra en el diseño, optimización y validación de Expert Advisors que operan de forma coordinada como portafolio. Aplico análisis de correlación, cobertura temporal y diversificación por clase de activo para construir sistemas que no dependan de un solo instrumento ni de una sola estrategia.
Actualmente gestiono portafolios algorítmicos que cubren forex, índices, metales, energía y acciones estadounidenses, operando en múltiples sesiones y marcos temporales de forma simultánea.
Comparto mi experiencia a través de artículos técnicos y herramientas de código abierto en esta comunidad. Creo que el salto de "construir EAs individuales" a "ingeniería de portafolios" es la transición que separa al trader retail del institucional, y esa es la línea que guía todo lo que publico aquí.
Backtests often understate spread, commission, and slippage. This MQL5 analyzer loads closing deals and simulates rising execution costs to measure robustness. It computes the breakeven cost per deal, the cushion over an assumed cost, the net profit and profit factor at that cost, and how many winners turn into losers, then summarizes the result with an A+ to F grade and targeted guidance.
Net profit and win rate tell you how much a strategy made, not how the result is distributed. This article builds a native MQL5 script that reads your closed trades and measures profit concentration: the top-N trade share, the Gini coefficient of the winners, an outlier-dependence stress test that removes the best few winners, and the largest day against a prop-firm consistency limit. It combines these into one A+ to F score with recommendations, running inside MetaTrader 5.
I was in a forum thread today about trailing stops on XAUUSD, and it made me put into words something I've been building my whole approach around for a while: almost every trailing method traders compare — EMA cross, Chandelier, ATR multiples, swing-structure trails — gets judged on a single backtest run over one continuous chunk of history. The "best" multiplier or ladder step that wins that test isn't actually the best method. It's the method that happened to fit whatever mix of trend and chop was sitting in that sample.
The fix I use is simple to describe and annoying to implement properly: split the history into volatility regimes first (I use ATR percentile over a rolling window, expansion vs. compression), then optimize and validate each piece of logic separately per regime instead of once over the whole dataset. A structural trail wins clearly in expansion. In compression it just gets chopped up by noise, and something tighter does better there. Neither method is "the winner" — the regime decides which one applies.
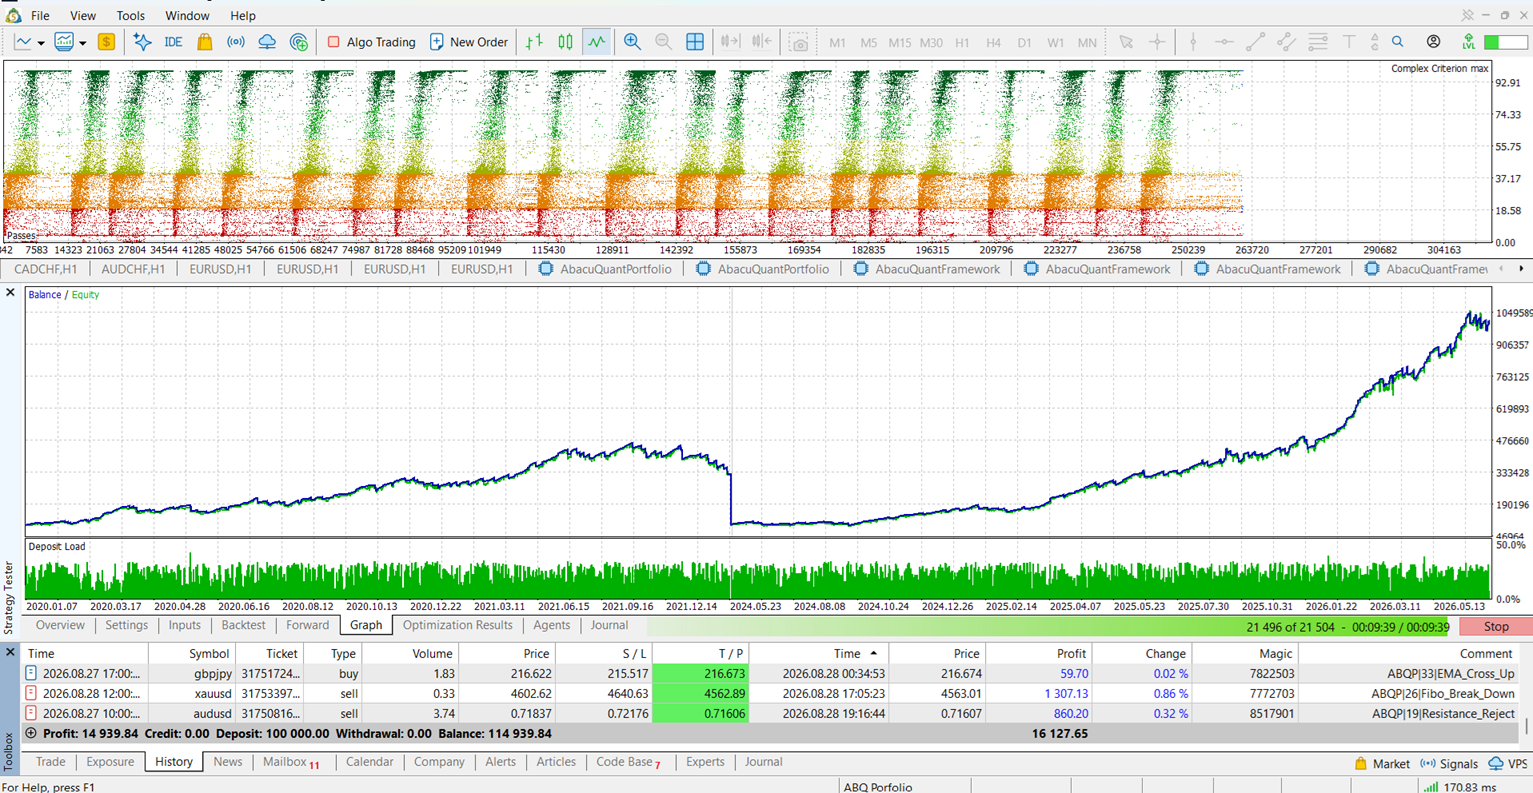
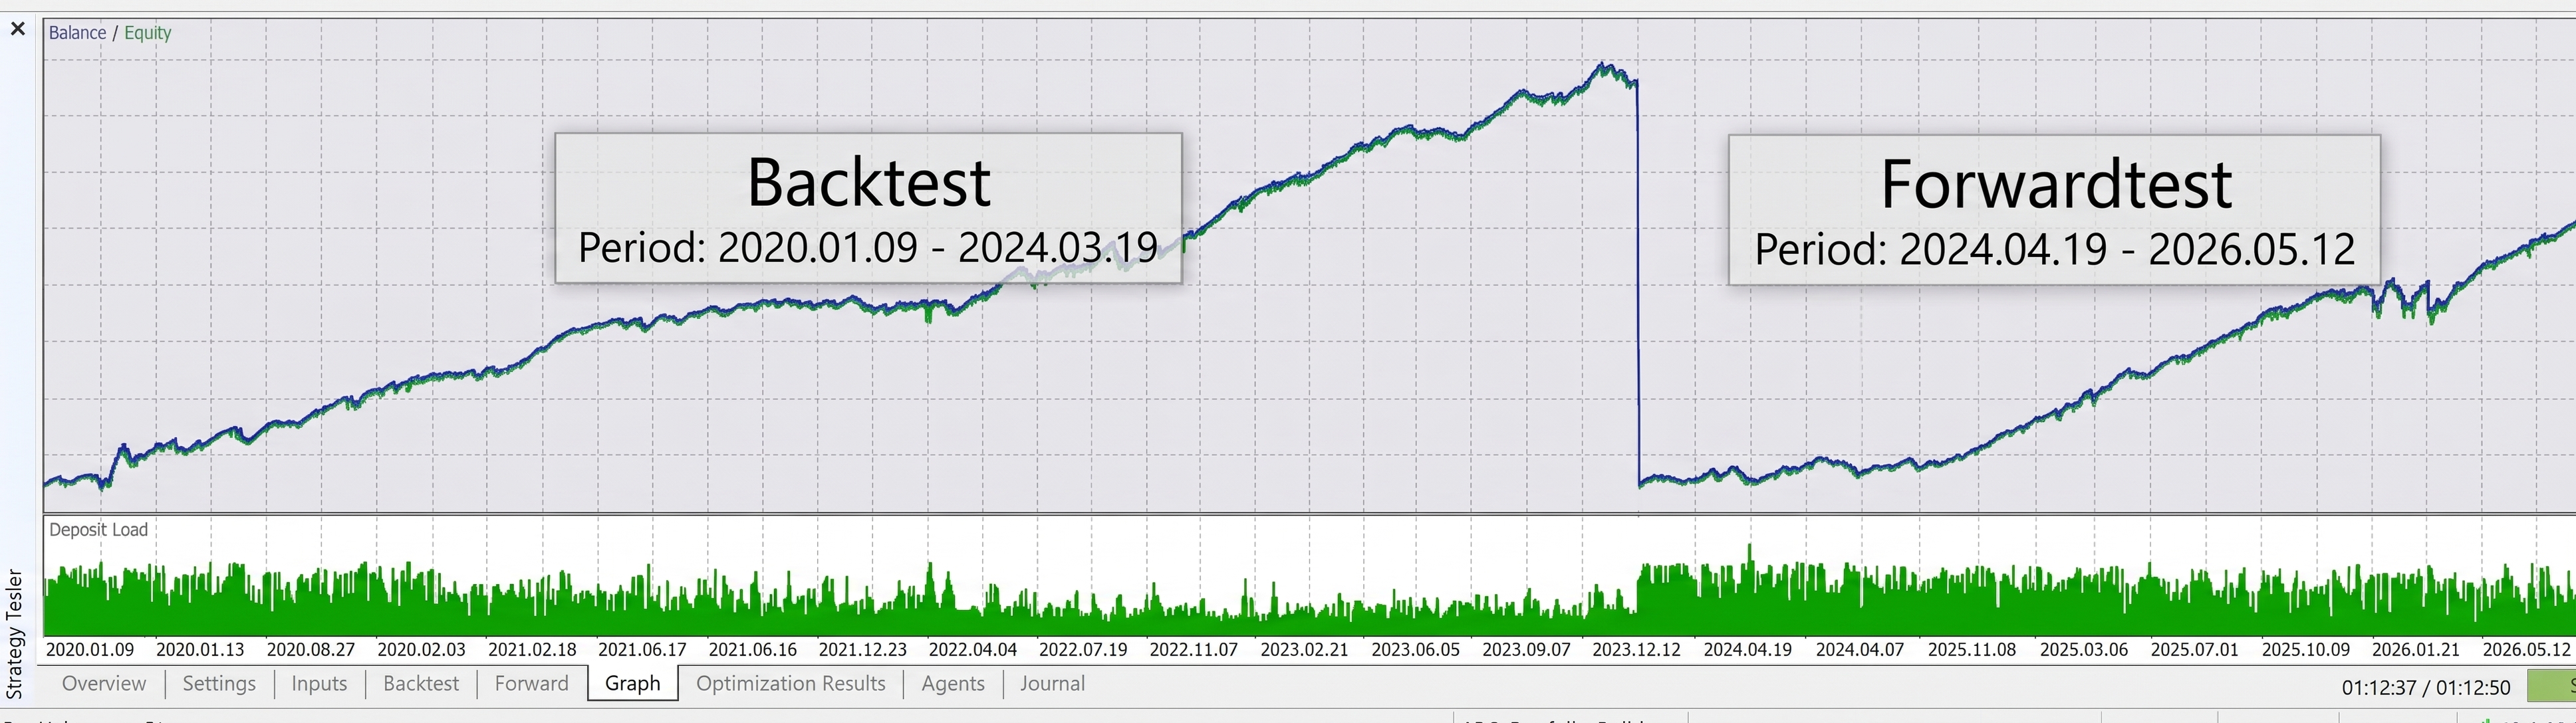
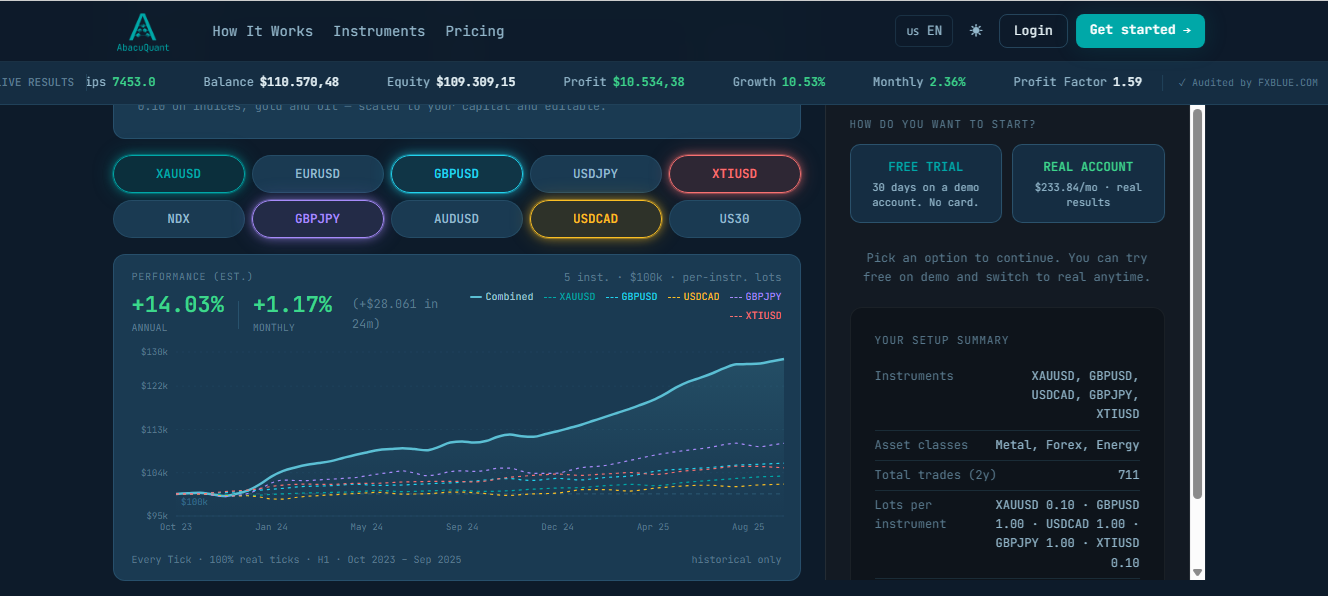
That's the same principle I ended up building AbacuQuant around, just scaled up from one exit rule to an entire portfolio. Instead of one strategy tuned to look good on one backtest, the logic behind each strategy is walk-forward tested and optimized (genetic optimization, not a single curve-fit) across different market regimes and asset classes, forex, metals, indices, energy, ETFs, individual stocks — and then combined into a portfolio specifically to keep cross-asset correlation low (the current version sits under 0.4 correlation across most pairs in the book). The idea isn't "find the one strategy that beats the market." It's "find enough structurally different, regime-validated pieces that the portfolio doesn't fall apart when one regime ends," which is exactly the failure mode people are describing in that XAUUSD thread, just at the position level instead of the portfolio level.
It also runs entirely inside your own MetaTrader account nothing custodial, your funds never move to a third party and the newer version adds the drawdown/consistency rules prop firms check for, since that's become how a lot of people are actually trading it live.
If any of this is useful for how you're thinking about your own trailing logic or portfolio construction, happy to go deeper in the comments. And if you want to see what the regime-validated approach looks like applied across a full portfolio rather than one exit rule, it's at abacuquant.com.
Cristian David Castillo Arrieta
Maximum drawdown is one number that hides what really matters: how often an equity curve declines, how long it stays below a previous peak, and how quickly it recovers. This article builds a native MQL5 tool that reconstructs the underwater curve, breaks it into individual drawdown episodes (depth, duration, recovery time), computes the Ulcer Index, Pain Index, and Recovery Factor, and combines them into a single resilience grade with practical recommendations. No external libraries, no Python, no AI.
Funded Trade Manager MT5 La mayoría de las cuentas financiadas no se pierden por una mala estrategia. Se pierden por un solo día en el que se fue demasiado lejos: una posición excesivamente grande, una operación de revancha, un límite de pérdidas diario superado. Prop Firm Guard es un panel de gráficos que aplica los mismos límites que aplica tu empresa de financiación, antes de que lo haga la propia empresa. Qué hace Realiza un seguimiento en tiempo real de tu límite de pérdidas diario y de tu
Most algo traders optimize Expert Advisors individually but never measure how they behave together on a single account. Correlated strategies amplify drawdowns instead of reducing them, and coverage gaps leave portfolios blind during entire trading sessions. This article builds a complete portfolio scorer in MQL5 that reads daily P&L from backtest CSV files, computes a full Pearson correlation matrix, maps trading activity by hour and weekday, evaluates asset class diversity, and outputs a composite grade from A+ to F. All source code is included; no external libraries are required.
ABQ Portfolio Correlation Scorer: Inteligencia Artificial de Grado Institucional para la Gestión de Riesgo La mayoría de los traders no fracasan por una mala estrategia de entrada, sino por una falla invisible en la arquitectura de su portafolio . El error más común es la sobreexposición por correlación: abrir múltiples posiciones pensando que se está diversificando, cuando en realidad se está multiplicando el riesgo sobre un mismo factor. ABQ Portfolio Correlation Scorer es un Copiloto de
ABQ Visual Risk Sizer - Institutional Risk & Trade Execution Category: Utilities / Risk Management El calculo manual de lotes cuesta tiempo y dinero. En el trading moderno, especialmente al operar con cuentas de fondeo (Prop Firms), un error de calculo de lotaje o una demora de 5 segundos al introducir una orden puede significar violar la regla de Drawdown Diario o perder el precio de entrada perfecto. ABQ Visual Risk Sizer es una herramienta de grado institucional disenada para resolver