Stairway
- Indikatoren
-
Gennadiy Stanilevych
 Developments in the field of the "Trading Chaos" strategy involve the use of big data processing technology to generate trading signals and automate order placement based on those signals. All my software products are available on the "Market" page, which can be found at
 - Version: 6.0
- Aktualisiert: 21 November 2021
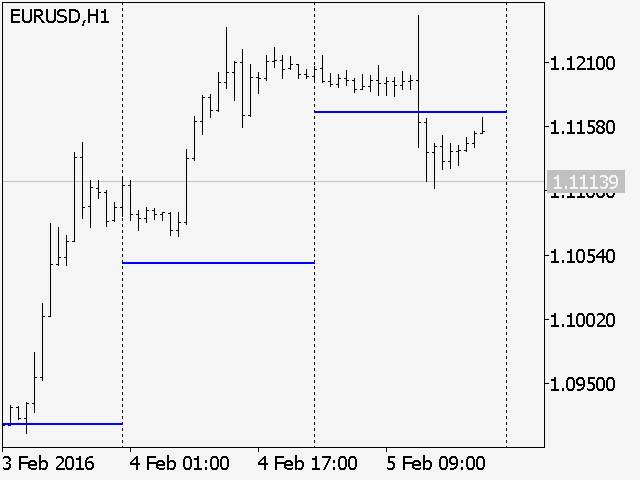
Der Multi-Timeframe-Indikator für die Niveaus der Pivot Points.
Jeder geschlossene Tageszeitraum hat seinen eigenen so genannten Referenzpunkt - Pivot Point, der die Niveaus für kleinere Intraday-Zeitrahmen für den folgenden Tag festlegt. Die in den Codes vorhandenen Pivot-Point-Indikatoren haben keine Methode, um die Dynamik der Pivot-Point-Änderungen auf den historischen Daten des Preisdiagramms anzuzeigen.
Formel zur Berechnung des Pivot-Punktes.
Pivot=(Hoch + Tief + Schluss) /3
High - das Maximum des Vortages;
Low - das Minimum des Vortages;
Close - der Schlusskurs des Vortages;
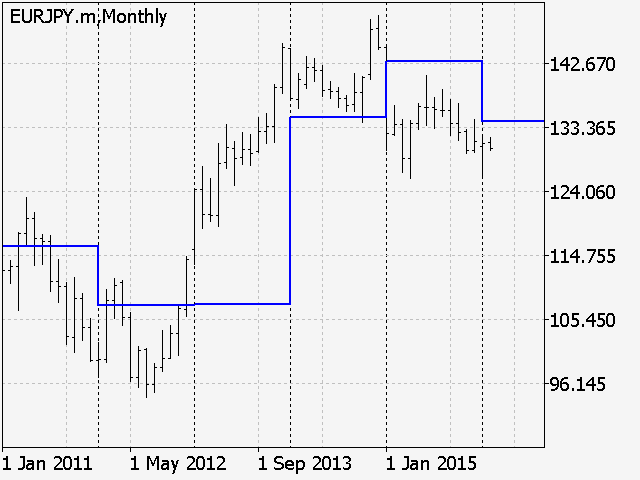
Diese Berechnung gilt auch für den wöchentlichen, monatlichen und sogar jährlichen Zeitraum.
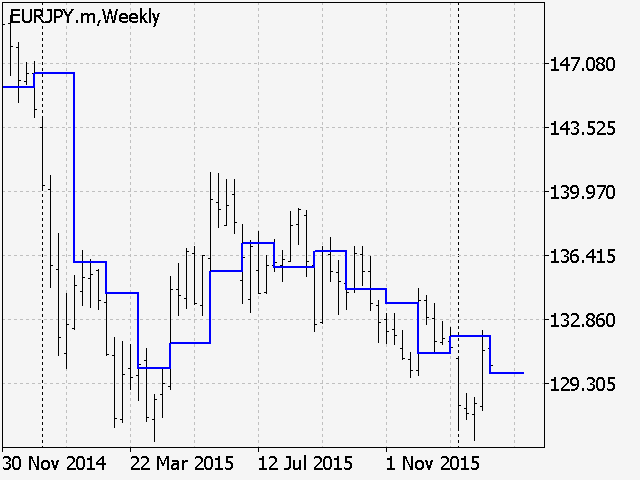
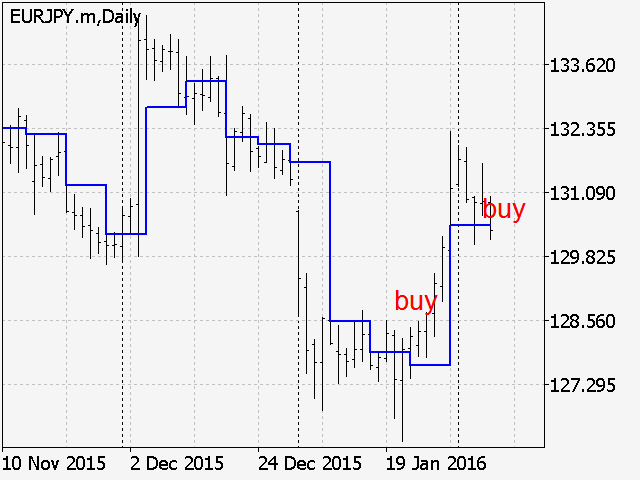
Wenn es keine Jahreskerzen auf dem Diagramm gibt, kann die Pivot-Ebene für das vergangene Jahr auf der Grundlage der Daten der Höchst- und Tiefstwerte des vergangenen Jahres sowie des Schlusskurses des letzten Monats des vergangenen Jahres berechnet werden. Und so weiter, die Berechnung des Pivot-Punktes des Monats wird die Widerstands- oder Unterstützungslinie für das Wochenchart sein, und der Pivot-Punkt der Woche - für das Tageschart.
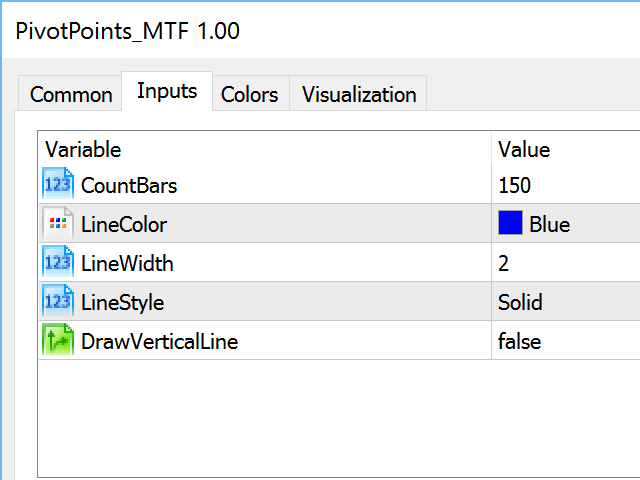
Es handelt sich um einen vielseitigen Indikator für das automatische Plotten der Pivot-Punkte auf der Grundlage der berechneten Pivot-Punkte für alle Perioden. Zu den Einstellungen des Indikators gehört die Möglichkeit, die horizontalen Pivot-Punkt-Ebenen mit einer vertikalen Linie zu verbinden, was die Möglichkeit bietet, die "Leiter" der Pivot-Punkte nach oben oder unten im Chart anzuzeigen.
Außerdem können Sie in den Einstellungen die Breite und die Farbe der Pivot-Point-Level-Linien auswählen.
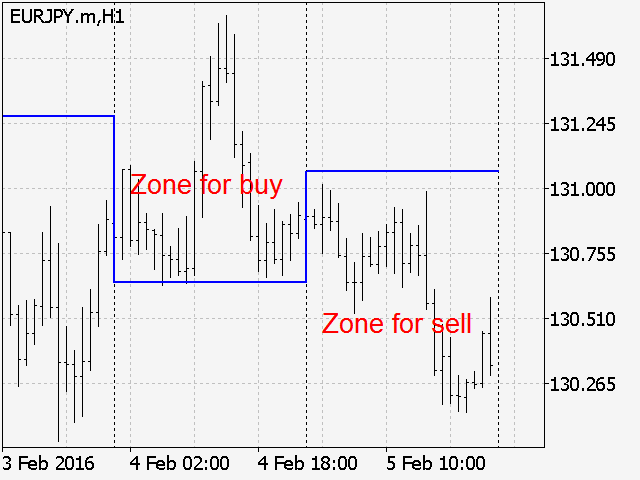
Die Strategie für den Handel mit Pivot-Point-Levels ist die folgende. Wenn der Markt des aktuellen Handelstages (Zeitraums) oberhalb des Pivot-Levels eröffnet, sollte das Instrument während des Handelstages (Zeitraums) bevorzugt gekauft werden. Eröffnet der Markt mit einem Preis unterhalb des Niveaus, sollten Short-Geschäfte bevorzugt werden.


good indicator