SMC Smart M0ney Concepts MT5
- Indikatoren
-
Hoang Ngoc Thach
 I'm trader and coder.
Please see my products at : https://www.mql5.com/en/users/rockyhoangdn/seller - Version: 1.0
- Aktivierungen: 15
Wenn Sie in letzter Zeit irgendwo in der Nähe von Forex-Foren oder sozialen Medien waren, haben Sie zweifellos gehört, wie die Leute überSmart Money Concepts (SMC) Trading gesprochen haben.
Sie fragen sich vielleicht, was SMC ist und ob es den ganzen Hype verdient. In diesem Beitrag stellen wir Ihnen den Smart Money Concepts-Handel vor, damit Sie eine fundierte Entscheidung darüber treffen können, ob Sie diese Strategie für Ihren eigenen Handel ausprobieren möchten.
Was ist SMC Forex-Handel?
Smart Money Concepts (SMC) ist eine von vielen Forex-Handelsmethoden. SMC erklärt, wie Smart Money auf dem Markt funktioniert und wie Forex-Händler es nutzen können, um einen profitablen Handelsplan zu erstellen.
Smart Money ist Kapital, das von institutionellen Anlegern, Zentralbanken und anderen Fachleuten oder Finanzinstituten verwaltet wird. Es wird von professionellen Anlegern verwaltet, die Markttrends vorhersagen und die höchsten Gewinne erzielen können.
Der einfachste Weg, den Handel mit Smart Money Concepts zu beschreiben, ist, zu sagen, dass es sich dabei um eine Preisaktion unter einem anderen Namen handelt.
SMC beinhaltet die Verwendung klassischer Forex-Konzepte wie Angebot und Nachfrage, Preismuster sowie Unterstützung und Widerstand für den Handel, aber alles wurde mit neuen Namen versehen und auf eine andere Weise beschrieben.
SMC-Händler beziehen sich auf Konzepte wie "Liquiditätsgrabs" und "Mitigation Blocks". Ihre Terminologie mag zwar fremd klingen, aber wenn Sie sich mit SMC beschäftigen, werden Sie feststellen, dass es sich um einen traditionelleren Handelsansatz handelt, als es auf den ersten Blick scheint.
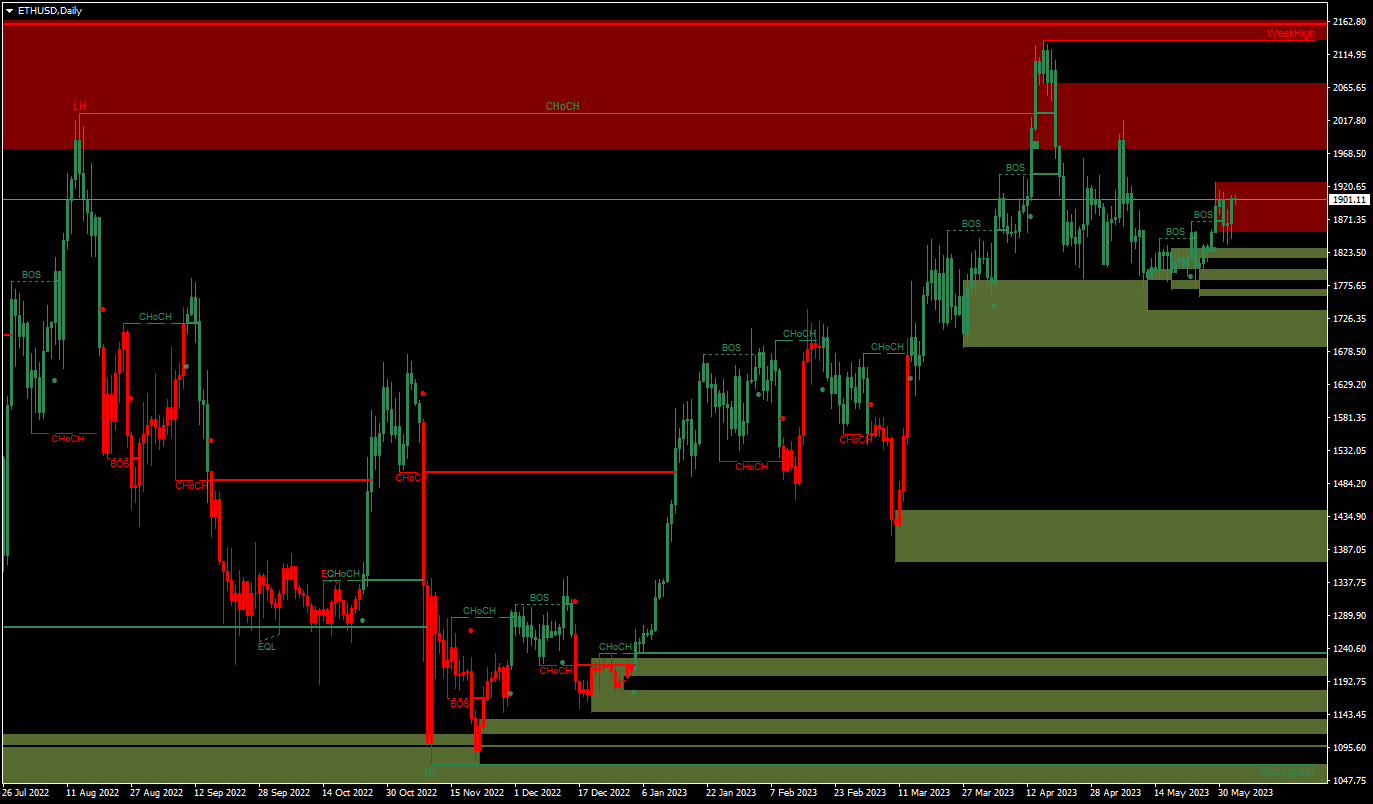
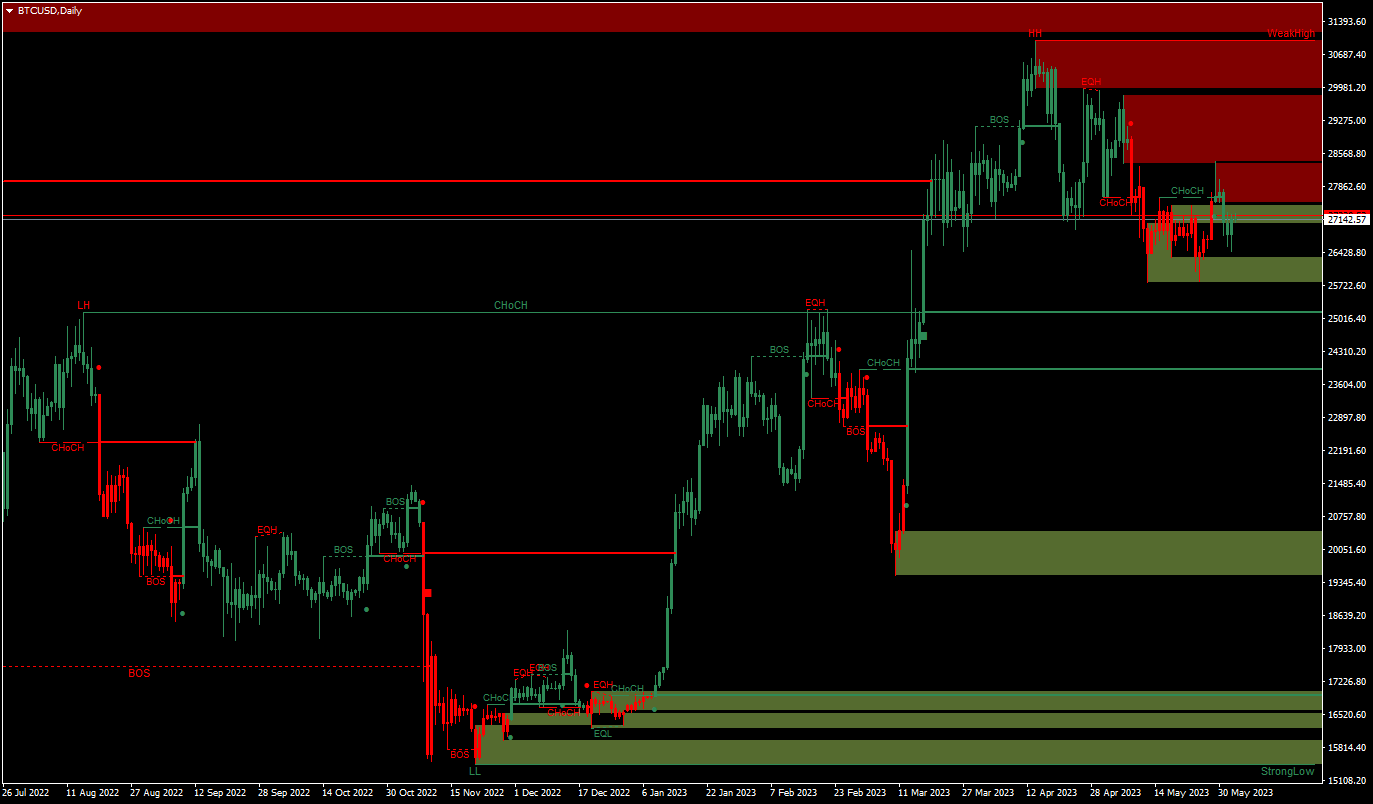
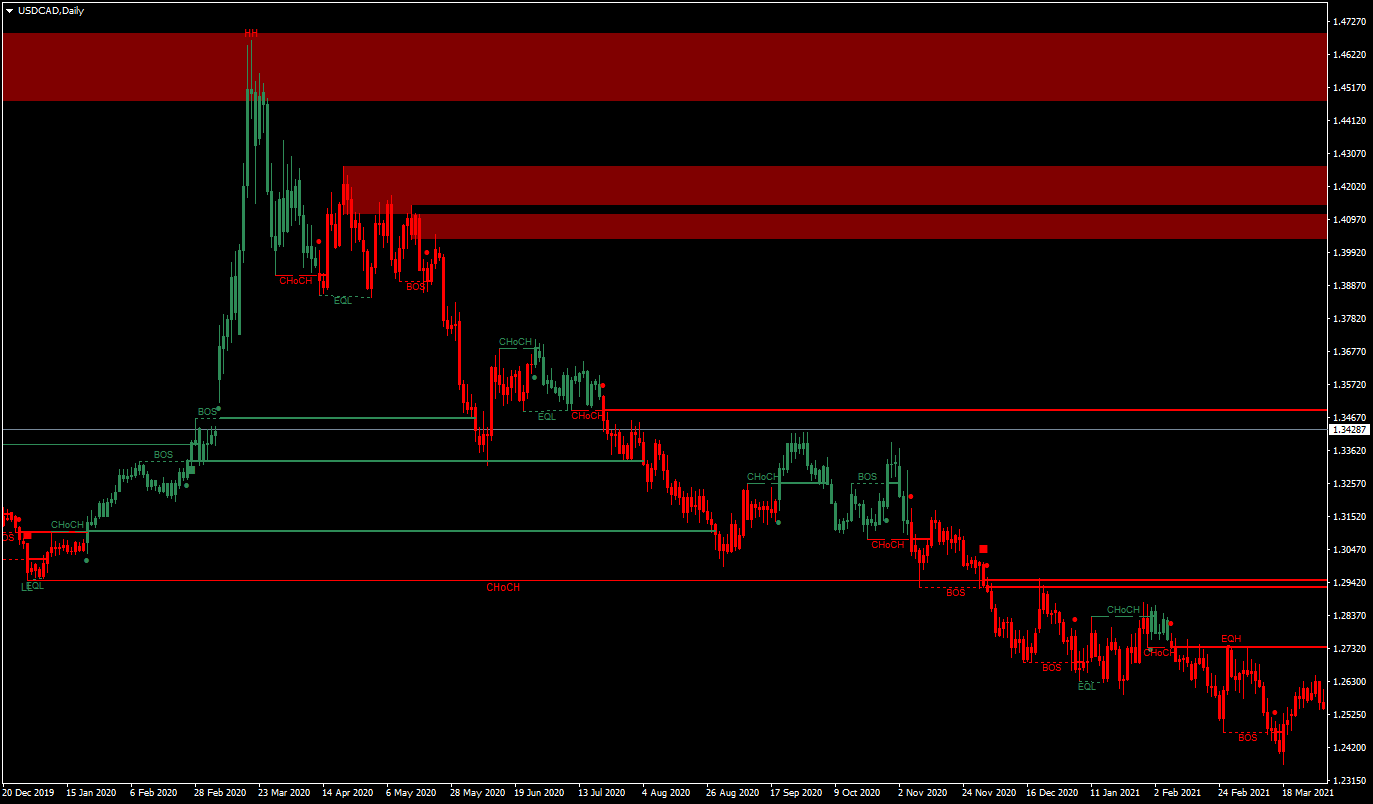
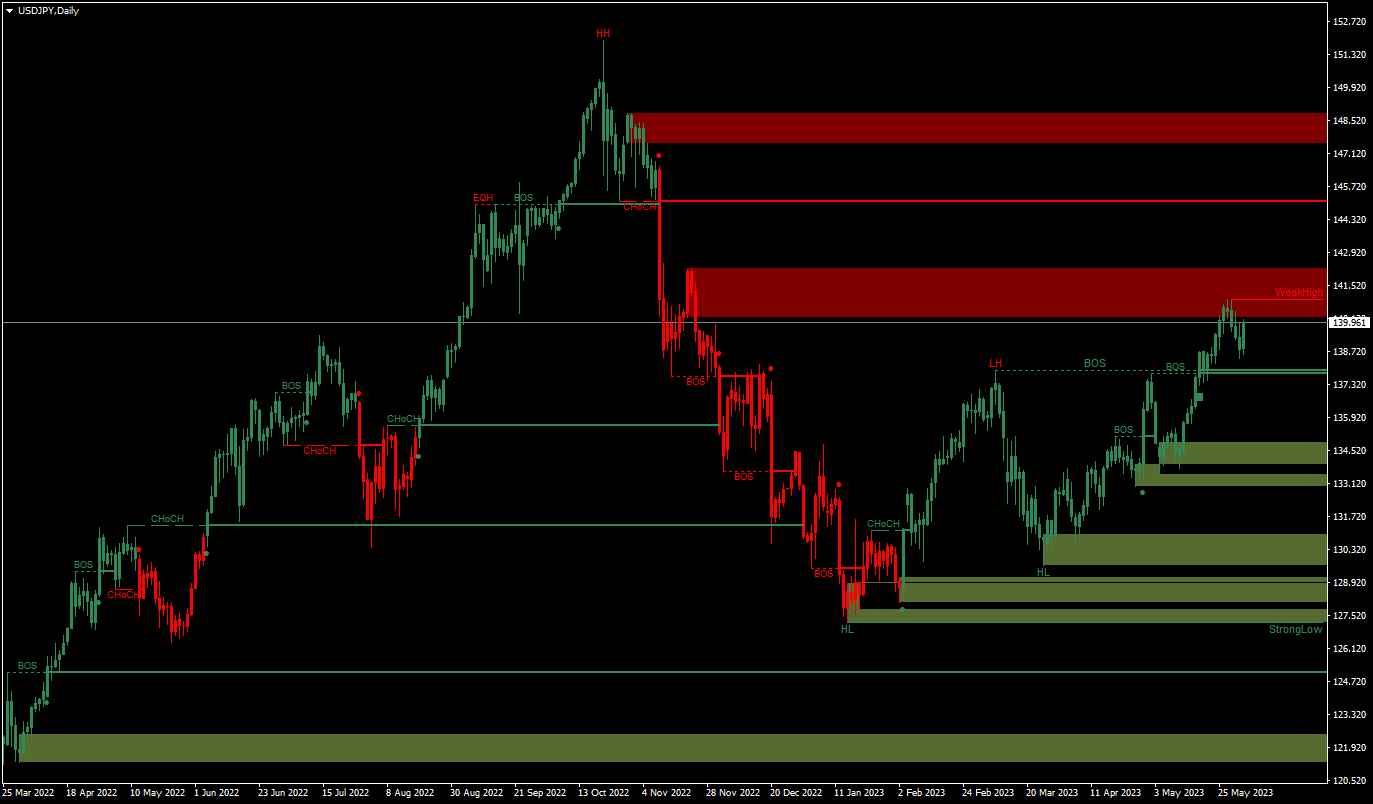
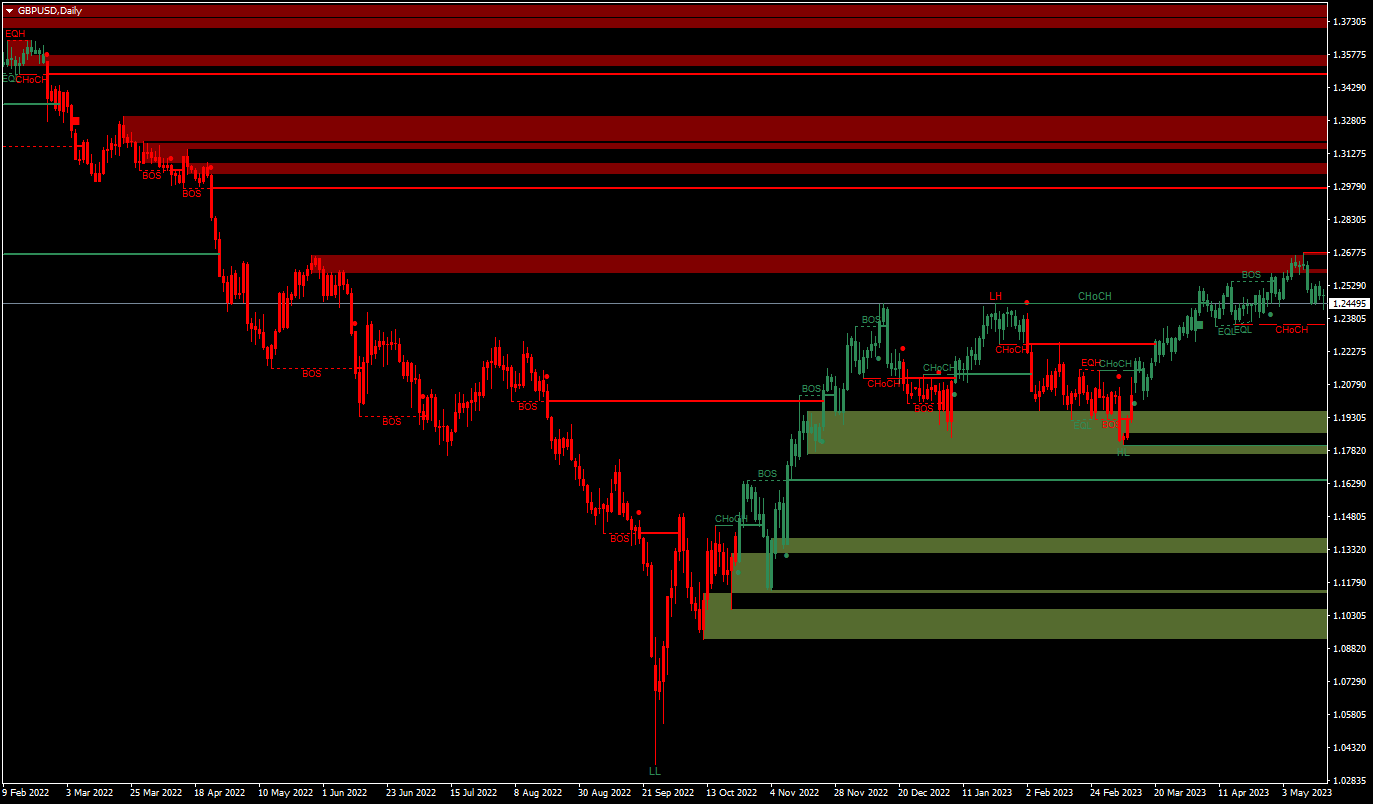
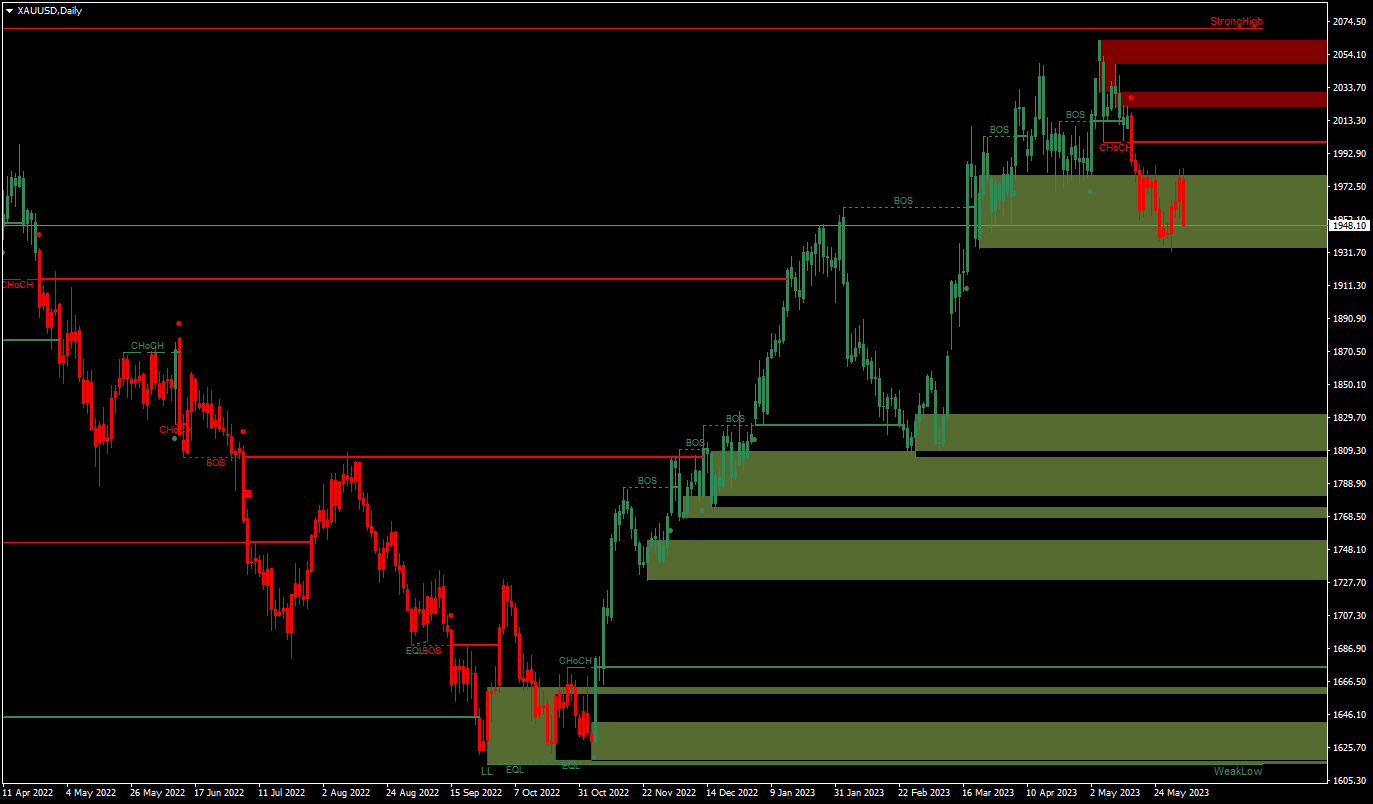
Merkmale
- Vollständige Kennzeichnung der internen und Swing-Marktstruktur in Echtzeit
- Strukturbruch (BOS), Charakterwechsel (CHoCH)
- Order-Blöcke
- Starke/schwache Hochs/Tiefs
- Gleiche Hochs und Tiefs
- Fair-Value-Gap-Erkennung, unterstützt FVG-Anzeige auf hohem Zeitrahmen
- Frühere Hochs & Tiefs
- Premium &Discount Zones als Bereich
- Alarm-Funktion
- Draw Candles Farbe nach Trend