Ultimate Price Action Compine MTF
- Indikatoren
-
Hoang Ngoc Thach
 I'm trader and coder.
Please see my products at : https://www.mql5.com/en/users/rockyhoangdn/seller - Version: 1.3
- Aktualisiert: 17 November 2021
- Aktivierungen: 20
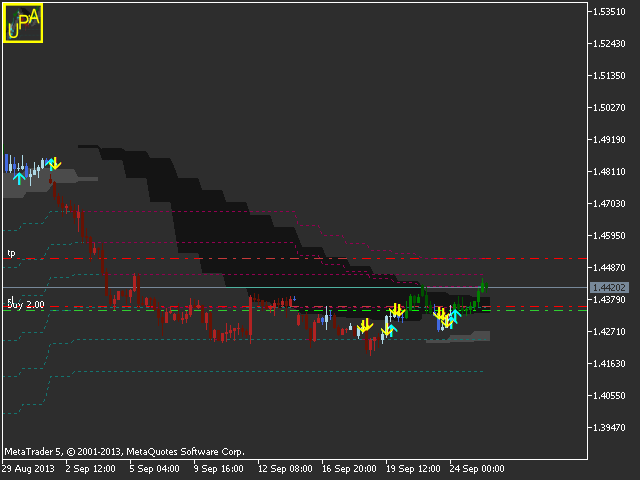
Wir versuchen, lang-, mittel- und kurzfristige Trends zu erkennen und kombinieren diese mit einigen Preisaktionsmustern, um einen guten Einstiegspunkt zu finden.
Die Vorteile des Indikators sind:
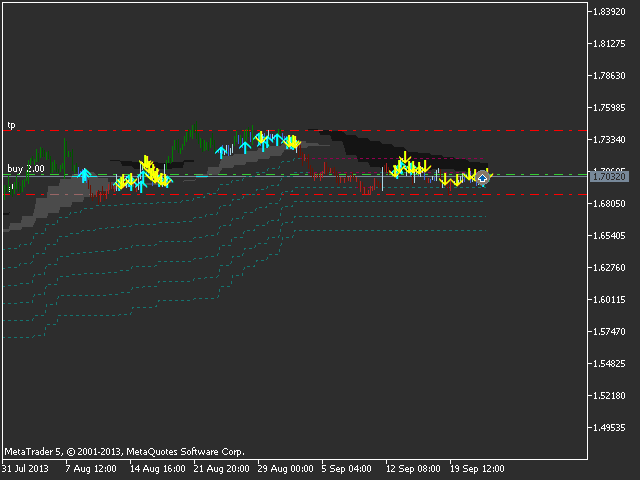
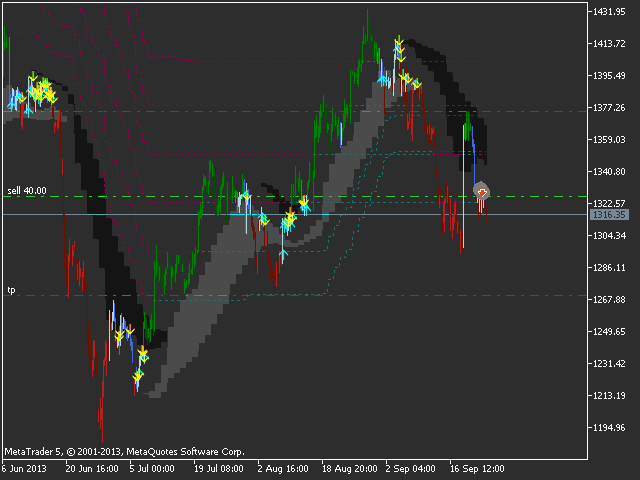
- Kann lang-/mittel-/kurzfristige Trends erkennen.
- Kann Widerstände/Unterstützungen erkennen (wie Pivot-Ebenen).
- Zeigt den Einstiegspunkt/-zeitpunkt durch farbige Pfeile an.
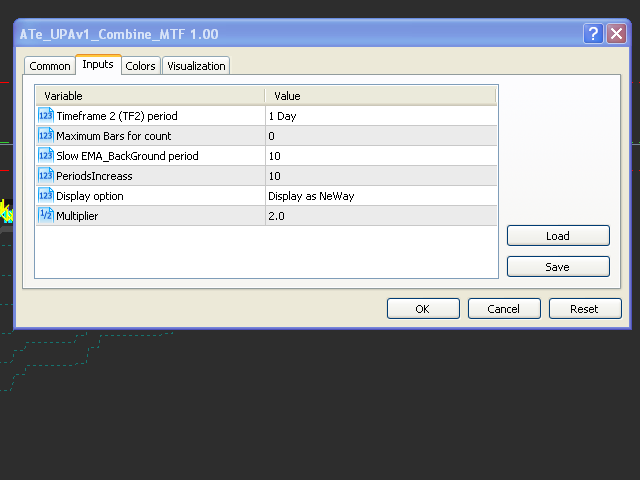
- Der Multitimeframe-Modus ist verfügbar.