RSI Scanner with Alerts MT5
- Indicatori
- Versione: 1.0
- Attivazioni: 5
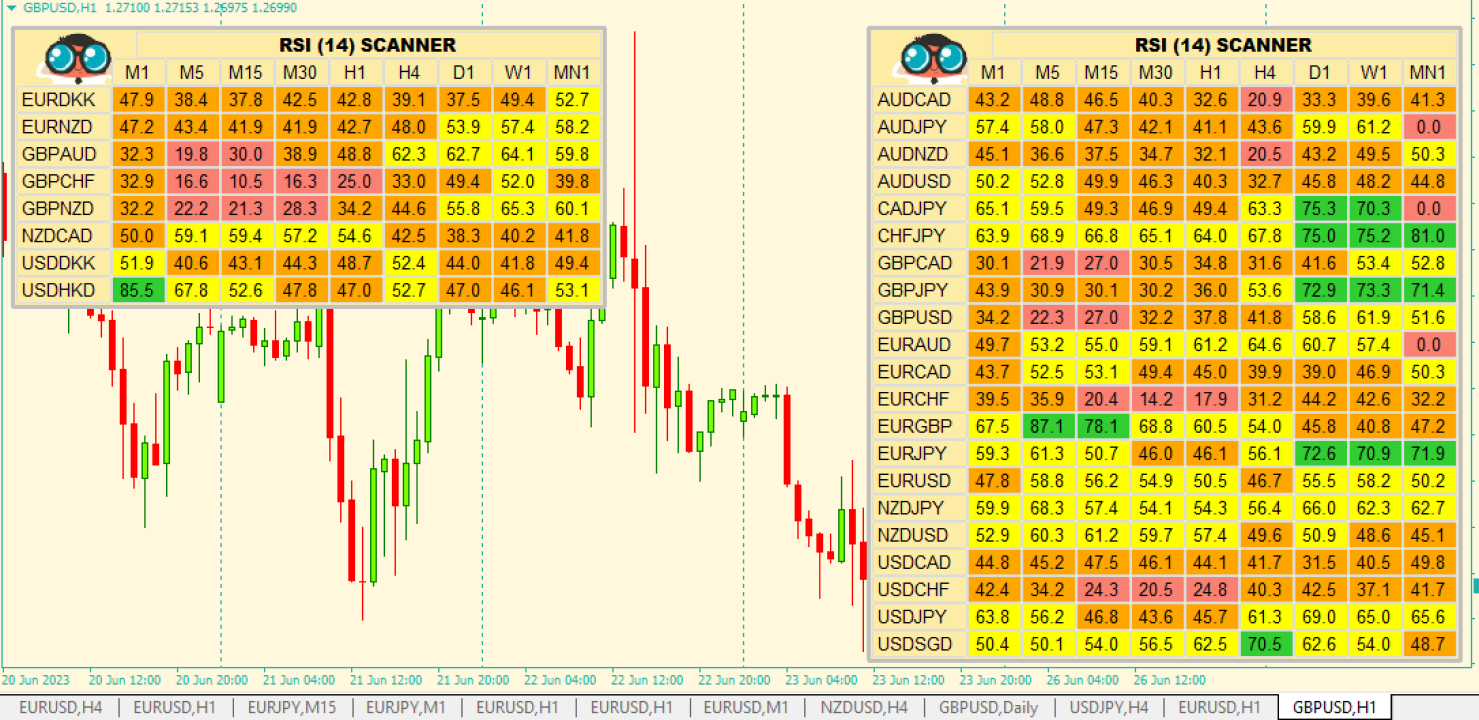
A useful scanner/dashboard that shows the RSI values for multiple symbols and Time-frames.
It can be easily hidden/displayed with a simple click on the scanner man top left of the dashboard.
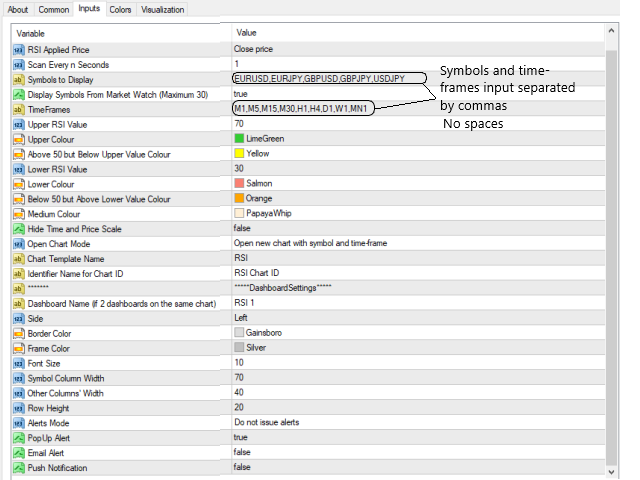
You can input upper and lower RSI values and the colours can be set to show when above/below these values. The default values are 70 and 30.
There are also input colours for when the RSI is above or below 50 (but not exceeding the upper/lower levels
Symbols and time-frames are input separated by commas.
Symbols can also be loaded from the Market Watch window. If there are more than 30 symbols, only the first 30 will be loaded.
You can choose whether the dashboard is displayed on the right or left of the chart.
If you want to have 2 dashboards on the same chart you must input a different name for each.
The scan is set on a timer and the default input is every 1 second. You can set it to a different period in the inputs
Important
I advise that you only use this dashboard with symbols and time-frames that you generally work with.
The iCustom handles are set up at initialization and that can be a problem if the history for the symbol and time-frame is not up to date.
In such case, the indicator will not be initialized and you will need to restart it.
There will be a report in the Experts tab for the symbol and time-frame where getting the handle failed.
If getting the handle keeps failing for the same symbol, you should open the chart and check that there is enough history. If not, delete it from the list.
ALERTS
You can set it to issue alerts when the upper or lower levels are hit.
Intra-bar alerts will trigger based on the last closed bar's RSI value and the current RSI value.
Eg. if the last bar closed RSI is below the upper RSI level and the current RSI value hits the upper level, an alert will be issued.
Only one alert will be issued per bar.
Closed-bar alerts will normally only trigger when a bar has just closed and are based on the just closed bar and the bar previous to that.
Eg. if the just closed bar RSI is above the upper level and the bar previous to that RSI value is below the upper level, an alert will be issued.
When the scanner is started you may get additional alerts initially while it updates.
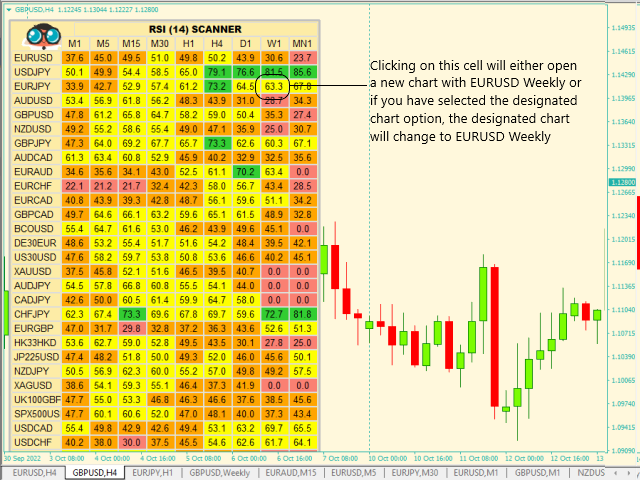
You can set up a chart template and call it "RSI" ( or whatever you like and change the input).
So if you are interested in EURUSD M15, just click on the relevant cell (across from EURUSD and below M15) and a new chart will open for EURUSD M15 with the "RSI" template applied.
It is not recommended that the template also has the scanner on it, just the RSI indicator and whatever else you may require.
If you prefer you can designate an already open chart and instead of a new chart opening, The symbol and time-frame will automatically be set on the designated chart.
To use this feature the indicator must know the Chart ID for the designated chart. Send me a message and I will send you the script to get the Chart ID (cannot attach it here)
You just need to fill in the identifier input for the chart when loading the script (ie. "RSI Chart ID") and the chart ID will be saved in a file. Input the same identifier name in the indicator so that it can find the chart.
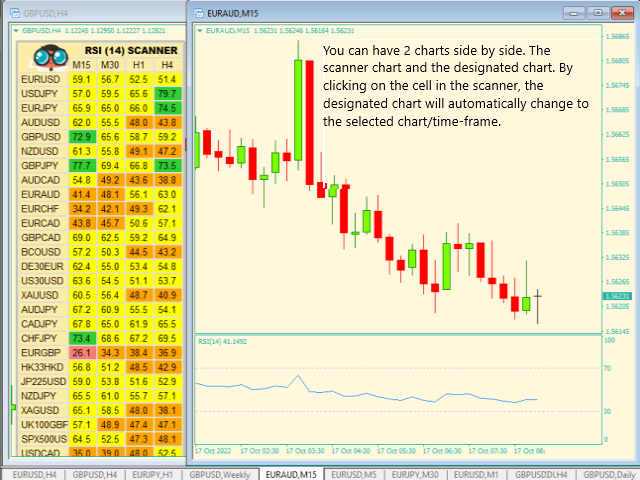
Some traders may prefer to keep 2 charts open side by side, one for the dasboard and one as the designated chart. When doing this you may want to hide the tine and price scales.
You can set this to true/false with the input "Hide Time and Price Scale".
Please note that the demo version has limited features.You can see the values update on the dashboard and the alerts do not pop up, they are printed in the journal.
The tester does not support opening additional charts when clicking on the cells.