Liquidity Pools
- Indikatoren
- Version: 6.0
- Aktivierungen: 5

Liebe Trader, schauen Sie sich meinen neuen Multi-Level-Marktliquiditäts-Indikator an: https://www.mql5.com/en/market/product/73098
Viele von Ihnen haben sehr gut mit diesem Indikator gehandelt, vielen Dank für die Unterstützung und die positiven Rückmeldungen!
Für weitere Informationen über Marktliquidität, eine Anleitung zur Verwendung dieses Indikators senden Sie mir bitte eine Nachricht.
Viele Informationen können im Netz gefunden werden. (Suche Liquiditätshandel/ Inner Circle Trader)
https://www.youtube.com/watch?v=yUpDZCbNBRI
https://www.youtube.com/watch?v=2LIad2etmY8& t=2054s
https://www.youtube.com/watch?v=wGsUoTCSitY& t=1124s
https://www.youtube.com/watch?v=5SwYZkXpw0E
Liquidität ist ein wichtiger Aspekt auf dem Markt, insbesondere für institutionelle Anleger, da sie viel Liquidität benötigen, um in den Markt ein- oder auszusteigen.
Das intelligente Geld fungiert als MARKET MAKER für die Herde. Mit anderen Worten: Das intelligente Geld ist das Gegenstück zum Überhang an Long- oder Short-Positionen, die von der Herde gehalten werden. Wenn die Herde netto short ist, ist das intelligente Geld netto long. Wenn die Herde netto long ist, dann ist das intelligente Geld netto short. Dadurch entsteht ein Interessenkonflikt zwischen dem intelligenten Geld und der Herde. Und aufgrund seiner überwältigenden Macht wird das kluge Geld immer gewinnen!
Dies erklärt, wie das kluge Geld arbeitet.
Daher konzentrieren sich institutionelle Händler mehr auf Nachfrage/Angebot-Metriken als auf die traditionellen technischen Analyseinstrumente und -techniken.
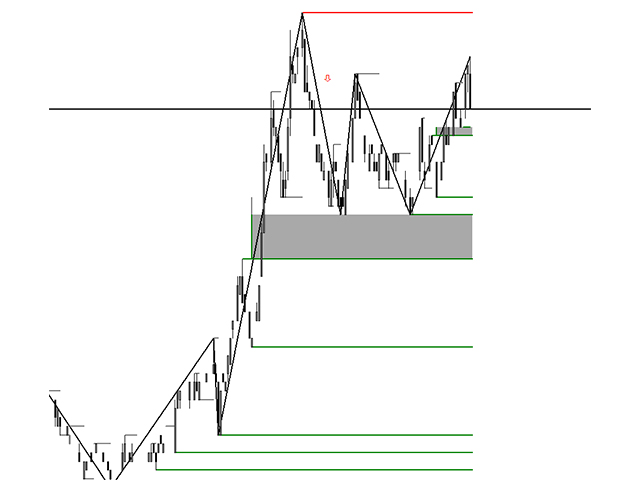
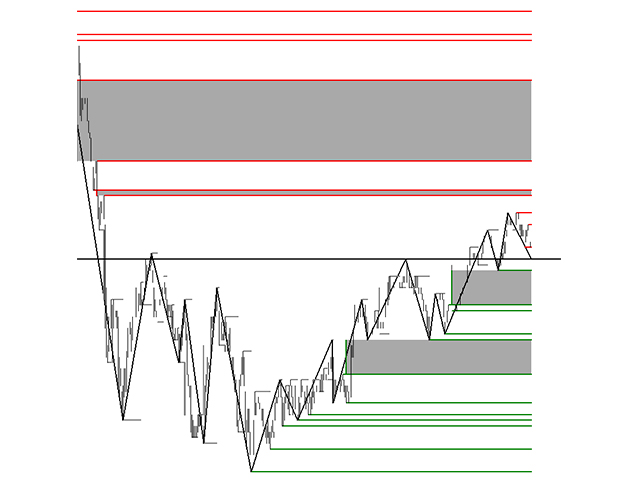
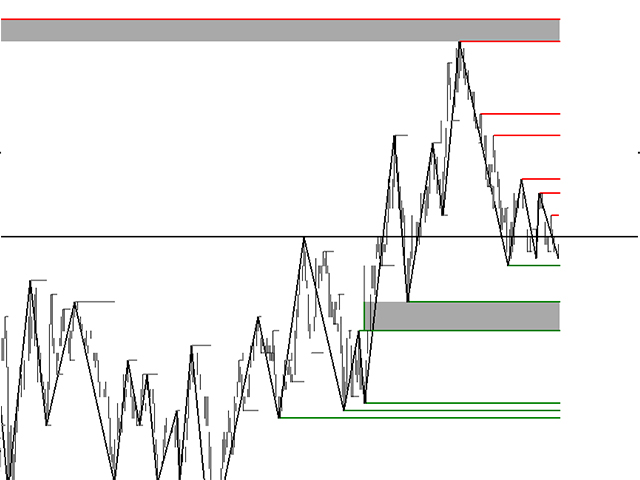
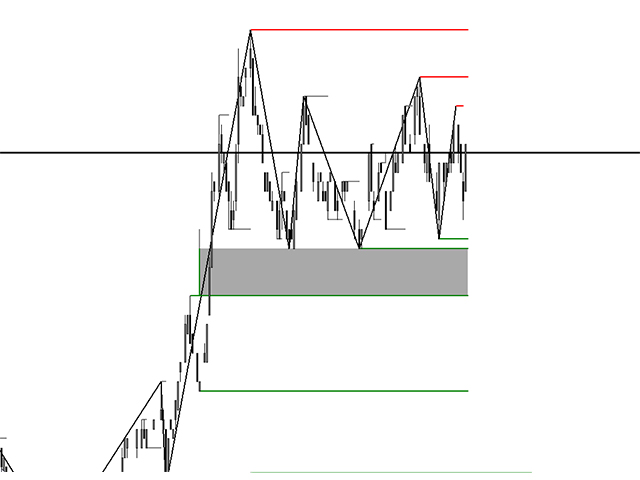
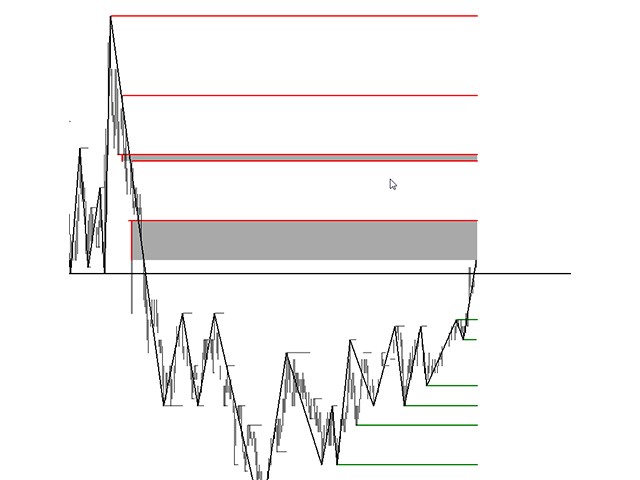
Neben den Unterstützungs- und Widerstandsniveaus zeigt es alle wichtigen Liquiditätsniveaus und -pools auf dem Markt an. Die Liquidität auf diesen Kursniveaus wird durch Stop-Loss-, Breakout- und Break-Even-Orders insbesondere von Einzelhändlern kumuliert. Je länger ein Unterstützungs- oder Widerstandsniveau anhält, desto mehr Liquidität sammelt sich knapp über/unter diesem Preisniveau an. Dies ist auch der Grund, warum systematisch alle Stop-Loss-Aufträge ausgeführt werden.
Alle diese Niveaus werden früher oder später von den Kursen durchbrochen, da die institutionellen Anleger den Kurs dorthin treiben, wo die Liquidität ist.
Durch diese Manipulation werden neue Liquiditätszonen geschaffen, die anschließend wieder durchbrochen werden.
Dieser Indikator ist nicht nur ein weiterer Unterstützungs- und Widerstandsindikator. Natürlich sind Unterstützungs- und Widerstandsniveaus auch Liquiditätsniveaus, da es eine Kumulation von Stop-Loss-, Breakout- und Break-Even-Orders gibt. Erreichte Niveaus werden auf dem Diagramm als graue Linien angezeigt. Auf diese Weise können Sie sehen, wie diese Niveaus Kursbewegungen wie ein Magnet anziehen.
Der Nutzen des Indikators für Trader:
- Erkennen Sie die Liquiditätsniveaus, die früher oder später den Preis anziehen werden.
- Vermeiden Sie es, Long-/Short-Positionen in der entgegengesetzten Richtung der Liquiditätspools einzugehen.
- Wenn sich der Kurs in Richtung Liquidität bewegt, ist es sehr wahrscheinlich, dass die Liquiditätszone teilweise oder sogar vollständig durchquert wird; verwenden Sie also den Indikator, um die Take-Profit-Order auf das Liquiditätsniveau zu setzen
- Eine Marktumkehr nach dem Überschreiten einer Liquiditätszone ist sehr stark, da die Anziehungskraft des aktuellen Kursniveaus weg ist.
Es gibt nicht viele Parameter für diesen Indikator, aber auf Anfrage bin ich für jeden Vorschlag oder jede Anpassung offen.
Der Indikator funktioniert auf jedem Instrument und in jedem Zeitrahmen.
Es gibt eine Demoversion dieses Indikators, die Sie im Strategietester verwenden können.
Sie werden den Nutzen und die Effektivität dieses Indikators sofort erkennen, schauen Sie sich das Video an (Devisenpaar EURUSD-ECN).
Danke fürs Teilen, wenn Sie zufrieden sind, hinterlassen Sie bitte eine positive Bewertung und einen Kommentar
Zögern Sie nicht, mich zu kontaktieren, wenn Sie Fragen haben oder unzufrieden sind.
WICHTIG: Einige Berechnungen basieren auf dem Standard-Zig-Zag-Indikator, der im Stammordner der Indikatoren vorhanden sein sollte.
Mr. Daelman knows perfectly well how strong hands work.
It is a unique indicator... sensational
Great Indicator. infinite possibilities