• Übersicht
  • Bewertungen (5)
  • Diskussion (4)
  • Neue Funktionen

Liquidity Levels

4.25
Liquidität ist ein wichtiger Aspekt auf dem Markt, insbesondere für institutionelle Anleger, da sie viel Liquidität benötigen, um in den Markt einzutreten oder aus dem Markt auszusteigen.

Das kluge Geld fungiert als MARKET MAKER für die Herde. Mit anderen Worten: Das intelligente Geld ist das Gegenstück zum Überhang von Long- oder Short-Positionen, die von der Herde gehalten werden. Wenn die Herde netto kurz ist, ist das kluge Geld netto lang. Wenn die Herde netto lang ist, ist das kluge Geld netto kurz. Dies führt zu einem Interessenkonflikt zwischen dem intelligenten Geld und der Herde. Und wegen seiner überwältigenden Kraft wird das kluge Geld immer gewinnen!
Dies, um zu erklären, wie das intelligente Geld funktioniert.

Daher konzentrieren sich institutionelle Händler mehr auf Nachfrage- / Angebotsmetriken als auf die traditionellen technischen Analysewerkzeuge und -techniken.

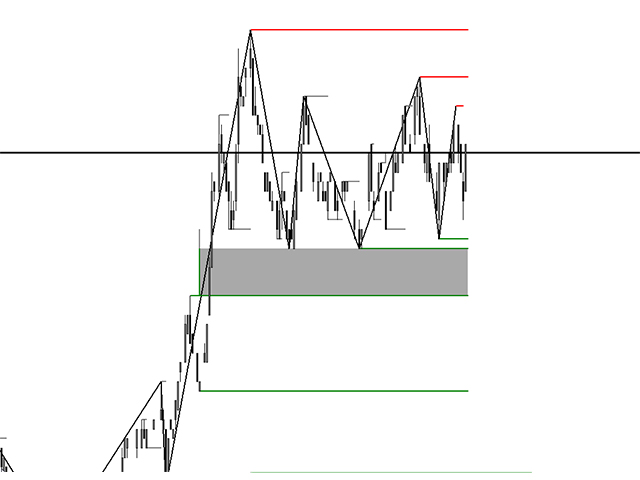
Neben den Unterstützungs- und Widerstandsniveaus werden alle wichtigen Liquiditätsniveaus und -pools auf dem Markt angezeigt. Die Liquidität auf diesen Preisniveaus wird durch Stop-Loss-, Breakout- und Break-Even-Aufträge insbesondere von Einzelhändlern kumuliert. Je länger ein Unterstützungs- oder Widerstandsniveau hält, desto mehr Liquidität wird knapp über / unter diesem Preisniveau angesammelt. Dies ist auch der Grund, warum systematisch alle Stop-Loss-Aufträge immer wieder getroffen werden.

Alle diese Niveaus werden früher oder später von Preisbewegungen getroffen, da institutionelle Anleger den Preis dahin treiben werden, wo sich die Liquidität befindet.
Durch diese Manipulation werden neue Liquiditätszonen geschaffen, die anschließend erneut überschritten werden.

Dieser Indikator ist nicht nur ein weiterer Unterstützungs- und Widerstandsindikator. Unterstützungs- und Widerstandsniveaus sind natürlich auch Liquiditätsniveaus, da Stop-Loss-, Breakout- und Break-Even-Aufträge kumuliert werden. Treffer, die getroffen wurden, bleiben als graue Linien im Diagramm. Auf diese Weise können Sie sehen, wie diese Niveaus als Magnet Preisbewegungen anziehen.

Die Verwendung des Indikators für Händler:

Sehen Sie sich die Liquiditätsniveaus an, die früher oder später den Preis anziehen werden
Vermeiden Sie Long- / Short-Positionen in entgegengesetzter Richtung zu den Liquiditätspools
Wenn sich der Preis in Richtung Liquidität bewegt, ist es sehr wahrscheinlich, dass die Liquiditätszone teilweise oder sogar vollständig überschritten wird. Verwenden Sie daher den Indikator, um die Take-Profit-Aufträge auf das Liquiditätsniveau zu bringen
Eine Marktumkehr nach dem Erreichen einer Liquiditätszone ist sehr stark, da die Anziehungskraft des aktuellen Preisniveaus weg ist.
Es gibt nicht viele Parameter für diesen Indikator, aber auf Anfrage bin ich offen für Vorschläge oder Anpassungen.

Es gibt eine Demoversion dieses Indikators, die im Strategietester verwendet werden kann.

Sie werden sofort die Verwendung und die Wirksamkeit dieses Indikators bemerken, sehen Sie sich das Video an.

Vielen Dank für das Teilen, bitte hinterlassen Sie einen Kommentar oder eine Bewertung.

WICHTIG: Einige Berechnungen basieren auf dem Standard-Zick-Zack-Indikator, der im Ordner mit den Stammindikatoren vorhanden sein sollte.
Bewertungen 5
tsomoney
209
tsomoney 2021.11.09 20:11 
 

this indicator has the potential to be your holy grail when used right. it's a perfect indicator for me.

gijs_best_service
21
gijs_best_service 2020.10.14 18:31 
 

Really good indicator!! Would be awesome to have some kind of manual to understand all the colors. Have been making good profits since using this indicator. Hope seller will respond on chat!

macdours
25
macdours 2020.11.05 00:10 
 

I too purchased the indicator but I am having to try and figure it out on my own, since there is no manual that comes with the indicator. I can see how it could be profitable but I have not used it yet. I have been waiting for the United States elections to finish up. If the seller could respond with a manual that would be extremely helpful.

Empfohlene Produkte
Der Indikator berechnet und zeichnet automatisch Fibonacci-Unterstützungs- und Widerstandsniveaus - eines der effektivsten Werkzeuge für die Marktanalyse. Die Berechnung verwendet die gemittelten Preisdaten für den ausgewählten Zeitraum und Zeitraum. Das Minimum und das Maximum für diesen Zeitraum gelten als Beginn und Ende der Bewegung. Fibonacci-Niveaus ermöglichen es Ihnen, potenzielle Referenzpunkte zu erkennen, um die sich die Preisbewegung verlangsamen oder umkehren kann, dh sie werden ver
Daily Candle Predictor ist ein Indikator, der den Schlusskurs einer Kerze vorhersagt. Der Indikator ist in erster Linie für die Verwendung in D1-Charts gedacht. Dieser Indikator eignet sich sowohl für den traditionellen Devisenhandel als auch für den Handel mit binären Optionen. Der Indikator kann als eigenständiges Handelssystem oder als Ergänzung zu Ihrem bestehenden Handelssystem verwendet werden. Dieser Indikator analysiert die aktuelle Kerze und berechnet bestimmte Stärkefaktoren innerhalb
VR Cub
Vladimir Pastushak
VR Cub ist ein Indikator für den Erhalt hochwertiger Einstiegspunkte. Der Indikator wurde entwickelt, um mathematische Berechnungen zu erleichtern und die Suche nach Einstiegspunkten in eine Position zu vereinfachen. Die Handelsstrategie, für die der Indikator geschrieben wurde, hat sich seit vielen Jahren bewährt. Ihr großer Vorteil liegt in der Einfachheit der Handelsstrategie, die es auch unerfahrenen Händlern ermöglicht, erfolgreich damit zu handeln. VR Cub berechnet Positionseröffnungspunkt
This indicator is, without a doubt, the best variation of the Gann Angles among others. It allows traders using Gann methods to automatically calculate the Gann angles for the traded instrument. The scale is automatically calculated when the indicator is attached to the chart. When switching timeframes, the indicator recalculates the scale for the current timeframe. Additionally, you can enter your own scales for the Gann angles. You can enter your own scales either for both vectors or for each
Mean Reversion Supply Demand Indicator Mean Reversion Supply Demand is the indicator to detect the important supply demand zone in your chart. The concept of supply demand trading relies on the quantity mismatching between buying and selling volumes in the financial market. Typically, supply demand zone serves to predict the turning point. The wave pattern, for any supply demand zone to work as an successful trade, looks like the price must touch the base zone, move away and then return to zone
Price Breakout pattern Scanner is the automatic scanner for traders and investors. It can detect following patterns automatically from your chart. Head and Shoulder - Common tradable pattern. Reverse Head and Shoulder - This pattern is the reverse formation of the Head and Shoulder. Double Top - When the price hits resistance level twice and decline toward the support level, the trader can anticipate sudden bearish breakout through the support level. Double Bottom - The double bottom pattern is
Monster Harmonic Indicator
Paul Geirnaerdt
4.61 (31)
Monster Harmonics Indicator is a harmonic pattern indicator. It recognizes Gartley, Bat, Crab, Butterfly, Cypher, White Swan, Black Swan, Shark and several other patterns. Projected patterns that are not yet completed are recognized, too. Monster even shows the PRZ (Potential Reversal Zone). Users can add their own user defined patterns to Monster. Besides the current pattern, Monster also shows all patterns in the symbols history. Monster will provide alerts for developing patterns. Introduced
PZ Swing Trading
PZ TRADING SLU
5 (4)
Swing Trading ist der erste Indikator, der Schwankungen in Trendrichtung und mögliche Umkehrschwankungen erkennt. Es wird der in der Handelsliteratur weit verbreitete Baseline-Swing-Trading-Ansatz verwendet. Der Indikator untersucht mehrere Preis- und Zeitvektoren, um die aggregierte Trendrichtung zu verfolgen und erkennt Situationen, in denen der Markt überverkauft oder überkauft ist und zur Korrektur bereit ist. [ Installationsanleitung | Update-Anleitung | Fehlerbehebung | FAQ | Alle Produkte
Blahtech Market Profile
Blahtech Limited
4.61 (18)
Was: $249  Now: $99   Market Profile defines a number of day types that can help the trader to determine market behaviour. A key feature is the Value Area, representing the range of price action where 70% of trading took place. Understanding the Value Area can give traders valuable insight into market direction and establish the higher odds trade. It is an excellent addition to any system you may be using. Blahtech Limited presents their Market Profile indicator for the MetaTrader community. Ins
This is an arrow indicator without a future function,developed based on the most advanced profit trading algorithms.It has the most innovative and advanced dual trend analysis module, as well as the latest and highly effective market trend prediction algorithm.Trends are your friends, and following larger trends can earn the maximum profit in foreign exchange. This indicator helps traders identify current trends and track them. Someone once made a profit of 10 times in a week by relying on it.No
PZ Support Resistance
PZ TRADING SLU
3.33 (3)
Sind Sie es leid, Unterstützungs- und Widerstandslinien zu zeichnen? Der Unterstützungswiderstand ist ein Multi-Zeitrahmen-Indikator, der Unterstützungs- und Widerstandslinien mit einer sehr interessanten Wendung automatisch erkennt und zeichnet: Wenn das Preisniveau im Laufe der Zeit getestet wird und seine Bedeutung zunimmt, werden die Linien dicker und dunkler. [ Installationsanleitung | Update-Anleitung | Fehlerbehebung | FAQ | Alle Produkte ] Steigern Sie Ihre technische Analyse über Nacht
RTrends
Nikolay Likhovid
The RTrends indicator does two things: first, it automatically draws the layout of the price chart by plotting trend lines and, secondly, it produces bearish and bullish signals. The layout reflects the fractal nature of the market. Trends from different time horizons are applied simultaneously on the chart. Thus, from a single chart a trader can see trend lines of higher timeframes. The lines, depending on the horizon, differ in color and width: the older the horizon, the thicker the line is. T
This is the FXTraderariel-TakeProfit - Stop Loss Indicator . It provides you 3 potential Take Profits and 1 Stop Loss. These potential targets are computed based on several methods . The indicator can be used on every time frame, but we advise to use it on H1, H4 and D1. Especially if you are a novice trader. Pro Traders can also you use it for scalping in smaller time frames (M1, M5 and M15). This indicator is not a complete trading system. It doesn't provide you a Signal nor can predict the m
Gold Bricks FX USES THE TREND WAVE INDICATOR AND IT CAN IDENTIFY THE BEGINNING AND THE END OF A NEW WAVE TREND MOVEMENT. AS AN OSCILLATOR, THE INDICATOR IDENTIFIES THE OVERBOUGHT AND OVERSOLD ZONES. IT WORKS GREAT TO CATCH THE SHORT TERM PRICE REVERSALS AND USES A MARTINGALE STRATEGY TO CLOSE ALL TRADES IN PROFIT. USE DEFAULT SETTINGS ON H1 OR HIGHER TIME FRAME ON ANY PAIR FOR MORE ACCURATE TRADES WHY THIS EA : Smart entries calculated by 4 great strategies The EA can be run on even a
Shark Deal Book
Philip Pankaj Suthagar
4 (3)
Term  "shark"  in the business world denotes a high volume investor who just made a good investment in a highly Potential business deal.So, sharks are the ones who make the market move. In our case, if an American shark bought a Japanese company, he/she has to convert American dollars into Japanese yen to make the deal. So, the demand for the Japanese yen will increase sharply. Thus USD/JPY will go short rapidly if the deal was from the shark. Another example, In the case of forex, if fed increa
Intraday Levels shows intraday levels grid for intraday trading Shows a grid for the day levels, gives you a guide to know the trend and to measure intraday trades (stop-loss and take-profit). Parameters are: Levels Mode: Basic mode: Shows highest, lowest and middle levels. Advanced mode: Shows highest, lowest, middle and intermediate levels. Fibonacci mode: Shows session Fibonacci retracements levels. Momentum mode: Shows delayed Advanced levels to identify momentum. Smooth Period (Momentum
Introduction to Chart Pattern MT Chart Pattern MT is a chart pattern scanner to detect the triangle pattern, falling wedge pattern, rising wedge pattern, channel pattern and so on. Chart Pattern MT uses highly sophisticated chart pattern detection algorithm. However, we have designed it in the easy to use with intuitive user interface. Chart Pattern MT will show all the patterns in your chart in the most efficient format for your trading. You do not have to do tedious manual pattern detection an
In the stock market technical analysis, support and resistance is a concept that the movement of the price of a security will tend to stop and reverse at certain predetermined price levels. Support and resistance levels can be identified on any timeframe. However, the most significant ones are found on the higher time frames, such as daily, weekly, and monthly. This indicator using the weekly OHLC data to identify the relevant levels. This is a support and resistance indicator and providing majo
KT Renko Patterns MT4
KEENBASE SOFTWARE SOLUTIONS
2.33 (3)
KT Renko Patterns scans the Renko chart brick by brick to find some famous chart patterns that are frequently used by traders across the various financial markets. Compared to the time-based charts, patterns based trading is easier and more evident on Renko charts due to their uncluttered appearance. KT Renko Patterns features multiple Renko patterns, and many of these patterns are extensively explained in the book titled Profitable Trading with Renko Charts by Prashant Shah. A 100% automate
Fourteen plus nine TD Sequential
MOHAMMED IMAD HUSSEIN BASSEE
Fourteen plus nine What is it for? Applying Tom DeMark’s TD Sequential serves the purpose of identifying a price point where an uptrend or a downtrend exhausts itself and reverses. . What are the main components of TD Sequential? TD Sequential has two parts – TD Setup and TD Countdown. The first phase of TD Sequential starts with a TD Setup and is completed with a 9 count. When the 9 count is completed, it is at that point, a price pause, price pullback, or reversal is likely. It is also at tha
Markt Rasierer   Markt Scalper Dieser Indikator ist Teil der Systeme von RPTrade Pro Solutions. Market Scalper ist ein täglicher Trendindikator, der Price Action, Dynamic Support und Resistances verwendet. Es ist so konzipiert, dass es von jedem verwendet werden kann, selbst der absolute Anfänger im Handel kann es verwenden. NIEMALS neu lackieren. Indikationen werden von nah zu nah gegeben. Für den alleinigen Gebrauch konzipiert, es sind keine weiteren Indikatoren erforderlich. Gibt Ihnen kla
The Chaikin Oscillator is a technical indicator developed by Marc Chaikin that combines price and volume data to measure the accumulation and distribution of a financial instrument. It aims to identify potential buying and selling opportunities in the market. The Chaikin Oscillator is calculated by subtracting a 10-day exponential moving average of the Accumulation Distribution Line (ADL) from a 3-day exponential moving average of the ADL. Here's how to use the Chaikin Oscillator indicator in tr
How to use Pair Trading Station Pair Trading Station is recommended for H1 time frame and you can use it for any currency pairs. To generate buy and sell signal, follow few steps below to apply Pair Trading Station to your MetaTrader terminal. When you load Pair Trading Station on your chart, Pair Trading station will assess available historical data in your MetaTrader platforms for each currency pair. On your chart, the amount of historical data available will be displayed for each currency pai
This is a new strategy for SUPPLY DEMAND areas It is based on a calculation using the tick volume to detect the big price action in market for both bear /bull actions this smart volume action candles are used to determine the supply and demand areas prices in between main supply and demand lines indicate sideway market  up arrows will be shown when prices moves above the main supply and the secondary supply lines Down arrows will be shown when prices moves below the main demand and the secondary
Gold Phoenix
Yaroslav Varankin
The perfect tool for Scalng in the Forex markets You can trade both from signal to signal and using take profit  The algorithm does not use Zigzag!  No redrawing!  This is a channel instrument that uses a moving average as a filter. Moving Average  There are 2 parameters for the settings Ma Period = 5 period Moving Average  Channel 1.0 distance of channel lines from the chart Price Signal Filter - calculation of signal opening and filter There is a complete set of Alert There is a multi-timefram
PZ 123 Pattern
PZ TRADING SLU
3.75 (4)
Das 123-Muster ist eines der beliebtesten, leistungsstärksten und flexibelsten Diagrammmuster. Das Muster besteht aus drei Preispunkten: einem Boden, einem Gipfel oder Tal und einem Fibonacci-Retracement zwischen 38,2% und 71,8%. Ein Muster gilt als gültig, wenn der Preis jenseits des letzten Gipfels oder Tals abbricht, in dem der Indikator einen Pfeil zeichnet, einen Alarm auslöst und der Handel platziert werden kann. [ Installationsanleitung | Update-Anleitung | Fehlerbehebung | FAQ | Alle Pr
Dies ist ein MTF-Indikator für Unterstützungs- und Widerstandsniveaus basierend auf den   Extremwerten des Advanced ZigZag Dynamic   und/oder   Extended Fractal   Indikators mit Preisetiketten (kann deaktiviert werden). Für den MTF-Modus können höhere TFs ausgewählt werden. Standardmäßig werden die Ebenen basierend auf ZigZag-Indikatorpunkten generiert. Fraktale Indikatorpunkte können auch zusammen mit ZigZag oder stattdessen verwendet werden. Um die Verwendung zu vereinfachen und CPU-Zeit zu sp
Candle GAP
Thushara Dissanayake
Der   Candle-GAP-   Indikator ist ein unverzichtbares Tool für Händler, die   Gap-Trading-Strategien   nutzen, da er automatisch Candle-Gaps für jeden Wochentag identifiziert. Eine Lücke bezieht sich auf einen Preisniveauunterschied zwischen dem Schluss- und Eröffnungskurs zweier aufeinanderfolgender Tage. Dieser Indikator erkennt vier Arten von Lückenmustern: Häufig, Abbruch, Fortsetzung und Erschöpfung. Durch die Integration dieses Indikators in jedes Diagramm können Händler ihre Signale valid
For sure, this indicator has become very popular amongst traders. Through coding this indicator will give you the most accurate levels possible for your trading analysis. We have also added in the ability for you to receive alerts when the price breaks above or below a Support or Resistance lines! HOW TO USE The red rectangles represent your resistance/supply zone. The green rectangles represent your support/demand zone.  BONUS FEATURES We coded this indicator with the ability to switch between
Advanced Trend Regime
Shellard Securities (Pty) Ltd
The indicator has been designed to function on any time-frame and any pair.   This regime filter will help the trader better evaluate whether the current market is trending, and in which direction. It quickly reacts to changes in market dynamics using a series of advanced calculations. The user is able to select whether the calculation remains standard, or if a further filter constraint is added to the calculation.   A Yellow moving average of the signal has been included for the trader to smoot
Käufer dieses Produkts erwarben auch
Atomic Analyst
Issam Kassas
5 (1)
Zunächst einmal ist es erwähnenswert, dass dieser Handelsindikator nicht neu malt, nicht neu zeichnet und keine Verzögerung aufweist, was ihn sowohl für manuellen als auch für Roboterhandel ideal macht. Der Atom-Analyst ist ein PA-Preisaktionsindikator, der die Stärke und das Momentum des Preises nutzt, um einen besseren Vorteil auf dem Markt zu finden. Ausgestattet mit fortschrittlichen Filtern, die helfen, Rauschen und falsche Signale zu entfernen, und das Handelspotenzial zu erhöhen. Durch
TPSproTREND PrO
Roman Podpora
5 (15)
TPSpro TRENDPRO  - is a trend indicator that automatically analyzes the market and provides information about the trend and each of its changes, as well as giving signals for entering trades without redrawing! The indicator uses each candle, analyzing them separately. referring to different impulses - up or down impulse. Exact entry points into transactions for currencies, crypto, metals, stocks, indices!  -  Version MT5               DETAILED DESCRIPTION        /       TRADING SETUPS           
Wir stellen vor       Quantum Trend Sniper Indicator   , der bahnbrechende MQL5-Indikator, der die Art und Weise, wie Sie Trendumkehrungen erkennen und handeln, verändert! Entwickelt von einem Team erfahrener Händler mit über 13 Jahren Handelserfahrung,       Quantum Trend Sniper-Indikator       wurde entwickelt, um Ihre Trading-Reise mit seiner innovativen Methode zur Identifizierung von Trendumkehrungen mit extrem hoher Genauigkeit auf ein neues Niveau zu heben. ***Kaufe Quantum Trend Snipe
TPSpro RFI Levels
Roman Podpora
5 (13)
A key element in trading is zones or levels from which decisions to buy or sell a trading instrument are made. Despite attempts by major players to conceal their presence in the market, they inevitably leave traces. Our task was to learn how to identify these traces and interpret them correctly. Reversal First Impulse levels (RFI)   -  Version MT5                INSTRUCTIONS                 RUS                 ENG                                       R ecommended to use with an indicator   -  
DERZEIT 26% RABATT Die beste Lösung für jeden Newbie oder Expert Trader! Dieser Indikator ist ein einzigartiges, qualitativ hochwertiges und erschwingliches Trading-Tool, da wir eine Reihe von proprietären Funktionen und eine neue Formel integriert haben. Mit nur EINEM Chart können Sie die Währungsstärke für 28 Forex-Paare ablesen! Stellen Sie sich vor, wie sich Ihr Handel verbessern wird, weil Sie in der Lage sind, den genauen Auslösungspunkt eines neuen Trends oder einer Scalping-Gelegenh
Derzeit 20% Rabatt! Die beste Lösung für jeden Neueinsteiger oder Expert Händler! Dieses Dashboard arbeitet mit 28 Währungspaaren. Es basiert auf 2 unserer Hauptindikatoren (Advanced Currency Strength 28 und Advanced Currency Impulse). Es bietet einen hervorragenden Überblick über den gesamten Forex-Markt. Es zeigt die Werte der Advanced Currency Strength, die Veränderungsrate der Währungen und die Signale für 28 Devisenpaare in allen (9) Zeitrahmen. Stellen Sie sich vor, wie sich Ihr Hande
Entry Points Pro
Yury Orlov
4.7 (224)
Dies ist ein Indikator für MT4, der genaue Signale für den Einstieg in einen Handel ohne Repainting (Neuzeichnen) liefert. Er kann auf alle Finanzwerte angewendet werden: Forex, Kryptowährungen, Metalle, Aktien, Indizes. Er liefert ziemlich genaue Schätzungen und sagt Ihnen, wann es am besten ist, eine Position zu eröffnen und zu schließen. Sehen Sie sich das Video (6:22) mit einem Beispiel für die Verarbeitung nur eines Signals an, das sich für den Indikator gelohnt hat! Die meisten Händler ver
Advanced Supply Demand
Bernhard Schweigert
4.92 (310)
Derzeit 33% Rabatt! Die beste Lösung für jeden Anfänger oder erfahrenen Händler! Dieser Indikator ist ein einzigartiges, qualitativ hochwertiges und erschwingliches Trading-Tool, da wir eine Reihe von proprietären Funktionen und eine neue Formel integriert haben. Mit diesem Update werden Sie in der Lage sein, doppelte Zeitrahmenzonen anzuzeigen. Sie können nicht nur einen höheren TF (Zeitrahmen) anzeigen, sondern sowohl den Chart-TF als auch den höheren TF: SHOWING NESTED ZONES. Alle Supply Dema
XQ Indicator MetaTrader 4
Marzena Maria Szmit
3 (2)
Step into the realm of Forex trading with confidence and precision using XQ, a cutting-edge Forex indicator designed to elevate your trading game to unprecedented heights. Whether you're a seasoned trader or just stepping into the world of currency exchange,   XQ Forex Indicator   empowers you with the insights and signals needed to make informed trading decisions. The signal conditions are a combination of three indicators, and XQ Forex Indicator only display  medium and long-term trends . The
TrendMaestro
Stefano Frisetti
5 (2)
note: this indicator is for METATRADER4, if you want the version for METATRADER5 this is the link: TRENDMAESTRO recognizes a new TREND in the bud, he never makes mistakes. The certainty of identifying a new TREND is priceless. DESCRIPTION TRENDMAESTRO identifies a new TREND in the bud, this indicator examines the volatility, volumes and momentum to identify the moment in which there is an explosion of one or more of these data and therefore the moment in which prices have strong probability of f
Präsentation des Miraculous Forex Indikators: Entfesseln Sie die Kraft präzisen Tradings Sind Sie es leid, nach dem besten Forex-Indikator zu suchen, der wirklich herausragende Ergebnisse in allen Zeitebenen liefert? Suchen Sie nicht weiter! Der Miraculous Forex Indikator ist da, um Ihre Trading-Erfahrung zu revolutionieren und Ihre Gewinne auf neue Höhen zu bringen. Basierend auf modernster Technologie und jahrelanger sorgfältiger Entwicklung steht der Miraculous Forex Indikator als Höhepunkt v
FX Power MT4 NG
Daniel Stein
5 (8)
Erhalten Sie Ihr tägliches Marktupdate mit Details und Screenshots über unser Morning Briefing hier auf mql5 und auf Telegram ! FX Power MT4 NG ist die nächste Generation unseres langjährig sehr beliebten Währungsstärkemessers FX Power. Und was bietet dieser Stärkezähler der nächsten Generation? Alles, was Sie am ursprünglichen FX Power geliebt haben PLUS GOLD/XAU-Stärkeanalyse Noch präzisere Berechnungsergebnisse Individuell konfigurierbare Analysezeiträume Anpassbares Berechnungslimit für noc
Quantum Breakout Indicator PRO
Bogdan Ion Puscasu
4.96 (26)
Wir stellen vor       Quantum Breakout PRO   , der bahnbrechende MQL5-Indikator, der die Art und Weise, wie Sie mit Breakout-Zonen handeln, verändert!   Quantum Breakout PRO   wurde von einem Team erfahrener Händler mit über 13 Jahren Handelserfahrung entwickelt und soll Ihre Handelsreise mit seiner innovativen und dynamischen Breakout-Zonen-Strategie auf ein neues Niveau bringen. Der Quantum Breakout Indicator zeigt Ihnen Signalpfeile auf Breakout-Zonen mit 5 Gewinnzielzonen und Stop-Loss
TakePropips Donchian Trend Pro
Eric John Pajarillaga Aldana
4.82 (17)
TakePropips Donchian Trend Pro   (MT4) ist ein leistungsstarkes und effektives Tool, das mithilfe des Donchian-Kanals automatisch die Richtung des Trends erkennt und Ihnen Handelssignale für den Ein- und Ausstieg liefert! Dieser Multifunktionsindikator umfasst einen Trendscanner, Handelssignale, ein statistisches Panel, einen Screener, Handelssitzungen und ein Dashboard für den Verlauf von Warnungen. Es wurde entwickelt, um Ihnen Handelssignale zu liefern und Ihnen Stunden beim Analysieren der C
Scalper Inside PRO
Alexey Minkov
4.75 (55)
SALE NOW! Limited Time Offer! An exclusive indicator that utilizes an innovative algorithm to swiftly and accurately determine the market trend. The indicator automatically calculates opening, closing, and profit levels, providing detailed trading statistics. With these features, you can choose the most appropriate trading instrument for the current market conditions. Additionally, you can easily integrate your own arrow indicators into Scalper Inside Pro to quickly evaluate their statistics and
FX Volume
Daniel Stein
4.6 (35)
Erhalten Sie Ihr tägliches Marktupdate mit Details und Screenshots über unser Morning Briefing hier auf mql5 und auf Telegram ! FX Volume ist der ERSTE und EINZIGE Volumenindikator, der einen ECHTEN Einblick in die Marktstimmung aus Sicht eines Brokers bietet. Es bietet fantastische Einblicke in die Positionierung von institutionellen Marktteilnehmern, wie z.B. Brokern, auf dem Forex-Markt, viel schneller als COT-Berichte. Diese Informationen direkt auf Ihrem Chart zu sehen, ist der wahre Game
Cycle Sniper
Elmira Memish
4.41 (34)
NEW YEAR SALE PRICE FOR LIMITED TIME!!! Please contact us after your purchase and we will send you the complimentary indicators to complete the system Cycle Sniper is not a holy grail but when you use it in a system which is explained in the videos, you will feel the difference. If you are not willing to focus on the charts designed with Cycle Sniper and other free tools we provide, we recommend not buying this indicator. We recommend watching the videos about the indiactor and system before pu
Shepherd Harmonic Pattern
Abdullah Alrai
4.68 (59)
Dieser Indikator erkennt harmonische Muster, die manuell oder automatisch auf dem Chart gezeichnet wurden. Sie können das Benutzerhandbuch unter diesem Link einsehen: Fügen Sie Ihre Bewertung hinzu und kontaktieren Sie uns, um es zu erhalten. Es gibt eine kostenlose Version, um dieses Produkt auf MT4 auszuprobieren. Sie können es verwenden, um Gartley- und Nenstar-Muster zu erkennen: https://www.mql5.com/en/market/product/30181 Sie können die vollständige MT4-Version von kaufen: https://www.mql5
RelicusRoad Pro
Relicus LLC
4.78 (139)
Jetzt 147 US -Dollar (nach ein paar Aktualisierungen auf 499 US -Dollar) - Unbegrenzte Konten (PCs oder MACs) RelicusRoad Benutzerhandbuch + Schulungsvideos + Zugang zur privaten Discord-Gruppe + VIP-Status EINE NEUE ART, DEN MARKT ZU BETRACHTEN RelicusRoad ist der weltweit leistungsstärkste Handelsindikator für Forex, Futures, Kryptowährungen, Aktien und Indizes und gibt Händlern alle Informationen und Tools, die sie benötigen, um profitabel zu bleiben. Wir bieten technische Analysen un
Wir stellen Ihnen ON Trade Waves Patterns Harmonic Elliot Wolfe vor, einen fortschrittlichen Indikator, der entwickelt wurde, um verschiedene Markt-Muster mithilfe sowohl manueller als auch automatischer Methoden zu erkennen. Hier ist, wie er funktioniert: Harmonische Muster: Dieser Indikator kann harmonische Muster erkennen, die auf Ihrem Chart erscheinen. Diese Muster sind für Trader, die die Theorie des harmonischen Handels praktizieren, wie sie in Scott Carney's Buch "Harmonic Trading vol 1
Currency Strength Exotics
Bernhard Schweigert
4.88 (33)
Stärke von 8 Währungen plus EIN EXOTISCHES Paar oder Rohstoffe oder Indexe! Jedes Produkt kann als 9. Linie hinzugefügt werden. Fügen Sie Rohstoffe, Indexes oder exotische Währungen hinzu (Gold, Silber, Öl, DAX, US30, MXN, TRY, CNH ...). Eine neue noch nie dagewesene TRADING STRATEGIE  !!! Dieser Indikator ist einzigartig, weil wir eine Reihe von proprietäre Funktionen und neue Formeln eingebaut haben. Es funktioniert für alle Zeitrahmen. Basierend auf neuen zugrunde liegenden Algorithmen ist
Th3Eng PipFinite PRO Indicator This product is distinct from the Th3Eng PipFinite Original, utilizing a different logic and algorithms. The Th3Eng PipFinite Pro indicator offers analysis of trend directions using custom algorithms. It provides indications of trend direction, entry points, a stop loss point, and three take profit points. The indicator also displays pivot points, dynamic support and resistance channels, and a side-box with detailed current signal information. How to Trade with
This Indicator does not repaint itself at all, it's identifies a new TREND in the bud, this indicator examines the volatility, volumes and momentum to identify the moment in which there is an explosion of one or more of these data and therefore the moment in which prices have strong probability of following a new TREND. CandleBarColorate never misses a beat, he always identifies a new TREND in the bud without error. This indicator facilitates the reading of charts on METATRADER; on a single wi
Ultimate Sniper Dashboard
Hispraise Chinedum Abraham
4.84 (25)
Ermäßigt auf $299! Die Preise können in Zukunft steigen! Lesen Sie die Beschreibung unten! Bestes Einstiegssystem für Ultimate Sniper Dashboard: ULTIMATIVE DYNAMISCHE EBENEN. (Bitte überprüfen Sie meine Produkte) Das Ultimate Sniper Dashboard funktioniert NUR auf Live-Märkten aufgrund der MT4 Multicurrency Testlimits. Wir stellen Ihnen das Ultimate-Sniper Dashboard vor! Unser bestes, das sowohl HA-Sniper, MA-Sniper und viele spezielle Modi enthält. Das Ultimate Sniper Dashboard ist ein
Natürlich, hier ist die Übersetzung in Deutsch: Vorstellung des Astronomie-Indikators für MT4: Dein ultimativer himmlischer Trading-Begleiter Bist du bereit, deine Trading-Erfahrung auf himmlische Höhen zu heben? Suche nicht weiter als unseren revolutionären Astronomie-Indikator für MT4. Dieses innovative Tool übertrifft herkömmliche Trading-Indikatoren und nutzt komplexe Algorithmen, um dir unvergleichliche astronomische Einblicke und präzise Berechnungen zu bieten. Ein Universum an Information
GOLD Impulse with Alert
Bernhard Schweigert
4.56 (9)
Dieser Indikator ist eine hervorragende Kombination aus unseren 2 Produkten Advanced Currency IMPULSE with ALERT  +   Currency Strength Exotics . Es funktioniert für alle Zeitrahmen und zeigt grafisch Impulse der Stärke oder Schwäche für die 8 wichtigsten Währungen plus ein Symbol! Dieser Indikator ist darauf spezialisiert, die Beschleunigung der Währungsstärke für beliebige Symbole wie Gold, Exotische Paare, Rohstoffe, Indizes oder Futures anzuzeigen. Als erster seiner Art kann jedes Sym
Supply and Demand Dashboard PRO
Bernhard Schweigert
4.82 (22)
Derzeit 20% reduziert! Dieses Dashboard ist eine sehr leistungsfähige Software, die mit mehreren Symbolen und bis zu 9 Zeitrahmen arbeitet. Es basiert auf unserem Hauptindikator (Beste Bewertungen: Advanced Supply Demand ).   Das Dashboard gibt einen guten Überblick. Es zeigt: Gefilterte Angebots- und Nachfragewerte einschließlich der Zonenstärkebewertung, Pips-Abstände zu/und innerhalb von Zonen, Es hebt verschachtelte Zonen hervor, Es gibt 4 Arten von Alarmen für die gewählten Symbole in
Price Action Entry Alerts
Stephen Sanjeeve Sahayam
5 (3)
Dieser Indikator überprüft jeden Balken auf Kauf- oder Verkaufsdruck und identifiziert 4 Arten von Kerzenmustern mit dem höchsten Volumen. Diese Kerzen werden dann mithilfe mehrerer linearer Filter gefiltert, um Kauf- oder Verkaufssignale anzuzeigen. Signale funktionieren am besten in Verbindung mit einer höheren Zeitrahmenrichtung und wenn sie während der Stunden mit hohem Handelsvolumen gehandelt werden. Alle Filter sind anpassbar und funktionieren unabhängig voneinander. Kann Signale einer e
The indicator is designed to work on any trading platform. The program is based on proprietary algorithms and W.D.Ganna's mathematics, allowing you to calculate target levels of price movement based on three points with the highest degree of certainty. It is a great tool for stock trading. The indicator has three buttons: NEW - call up a triangle for calculation. DEL - delete the selected triangle. DELS - completely remove all constructions. The probability of achieving the goals is more than 80
All in One Trade
Alexey Minkov
4.48 (27)
SALE NOW! Limited Time Offer! The All-in-One Trade Indicator (AOTI) determines daily targets for EURUSD, EURJPY, GBPUSD, USDCHF, EURGBP, EURCAD, EURAUD, AUDJPY, GBPAUD, GBPCAD, GBPCHF, GBPJPY, AUDUSD, and USDJPY. All other modules work with any trading instruments. The indicator includes various features, such as Double Channel trend direction, Price channel, MA Bands, Fibo levels, Climax Bar detection, and others. The AOTI indicator is based on several trading strategies, and created to simp
Weitere Produkte dieses Autors
Drag and Drop Stop Loss
Filip Maurice Daelman
Order management can become difficult, especially when many orders are open at the same time, long and short. With the standard tools from Metatrader, only one order can be changed at the time. In case you want to change the stop loss level or the take profit level of all your open orders this tool is for you. This tool allows to change easily the Stop loss level of ALL the open orders with a simple "Drag and Drop" on the chart. All the orders with the same chart symbol will be modified. Add t
FREE
Order management can become difficult, especially when many orders are open at the same time, long and short. With the standard tools from Metatrader, only one order can be changed at the time. In case you want to change the stop loss level or the take profit level of all your open orders this tool is for you. This tool allows to change easily the Take Profit level of ALL the open orders with a simple "Drag and Drop" on the chart. All the orders with the same chart symbol will be modified. Add
FREE
This indicator displays three forecast projections of the last market swings based on the Zig Zag indicator. Price action moves very often according to what happened in the near past, the indicator displays the price pattern that the market will possibly follow. Both short and long patterns are displayed in the chart with an indication of the target price level. If multiple projections overlap or almost overlap, then the next price movement becomes very likely. In this case it's a ranging market
Extreme Swing Indicator
Filip Maurice Daelman
3.67 (3)
Dear Trader, this is one of the most powerful signals you will find in the market place. I worked many months to improve the accuracy. Check for yourself with the demo version. Parameters are set for EURUSD. I can assist you to configure it for any other symbol or TF. It can be configured to generate more of less in-trend or contra-trend signals. Extreme Swing Indicator is a no-nonsense, no delay, no repaint indicator ! It selects buy/sell entry signals based on a number of swing calculations a
Liquidity Buy Sell Signal Indicator is a no-nonsense, no delay, no repaint indicator ! Liquidity pools together with a trend filter is the most powerful and reliable signal according to me (with the correct parameters depending on the timeframe used) It selects buy/sell entry signals based on liquidity in the market. The time range to scan for liquidity can be set in the parameters. Liquidity is an important aspect in the market, especially for institutional investors, as they need lots of liqu
Multi Level Trend Swing is an indicator that identifies the most accurate buy/sell swing points with the highest probability, based on multi-level Zig Zag Swings. The indicator paints arrows at the Higher Highs, Higher Lows, Lower Lows and Higher Lows in the chart, but based on two level Zig Zag Swing. If the fast price swing is in line with the trend of the slow price swing, then the buy/sell arrows are biggest. If the price swing is against the trend, dots are displayed to signal a Higher High
Multi MA Distance Signal Indicator is a no-nonsense, no delay, no repaint indicator ! Moving Average distance together with a trend filter is a 'simple', but very powerful and reliable signal. The current moving average distance for both a slow and a fast moving average is compared with the past MAD values. For two moving averages, all the distances between the Close price and the moving average (MAD) over a selected period of time are compared with the current MAD "Moving Average Distance". If
Multi MA Band Signal
Filip Maurice Daelman
Multi MA Band Signal Indicator is a no-nonsense, no delay, no repaint indicator ! Moving Average bands together with a RSI filter is a 'simple', but very powerful and reliable signal. Five "moving average bands" generate the signals. By default : MA25, 50, 100, 200 and 400. This can be changed in the parameters as well as the MA mode and the MA band deviation. The signal indicates the number of moving average bands that are crossed. The higher the value the stronger the signal. Two signal l
Multi Signal
Filip Maurice Daelman
Multi Signal Indicator contains a whole series of intersting buy,sell and exit signals that can be separately turned on/off. Signals : Liquidity Pools Liquidity Pools Forecast Projection Reversal Blocks Pinbar groups Overbought/Oversold with Moving Average Band (5 MA bands) Moving Average Difference Liquidity is an important aspect in the market, especially for institutional investors, as they need lots of liquidity to enter or exit the market. Therefore, institutional traders focus more on dema
Ultimum Signal
Filip Maurice Daelman
Ultimum Signal Indicator contains the most powerful buy,sell and exit signals. They can all be be separately turned on/off, so you decide what to display on the chart ! This is my ultimum inidicator that is a no-nonsense, no delay, no repaint indicator ! Signals : Target price levels : Liquidity Pools (Liquidity voids, major supply/demand zones, and price discrepancies) Liquidity Pools Forecast Projection Market Reversals : Reversal Blocks Pinbar groups Trend and mastertrend slowdowns (indicat
Black Cryptex
Filip Maurice Daelman
3 (1)
Extremely intelligent and complex algoritm developed for the Dax or Dow Jones Index. (1 Min Timeframe) Can also be configured for any other index or Forex pair or timeframe, but spread need to be tight. Very good risk/reward ratio. Market entry/exit at overbought/oversold price levels, based on complex calculations. Risk management is done by starting with a very small initial position. The position is optimised by averaging in an intelligent way. - Fast moving average reversal - Moving average
Multi Level Trend Direction
Filip Maurice Daelman
1 (1)
Multi Level Trend Direction is an indicator that identifies the most accurate buy/sell swing points with the highest probability, based on multi-level Zig Zag Swings. The indicator draws a color Zig Zag at the Higher Highs, Higher Lows, Lower Lows and Higher Lows in the chart, but based on two level Zig Zag Swing. If the fast price swing is in line with the trend of the slow price swing, then the buy/sell trend lines are bigger. If the price swing is against the trend, no lines are drawn to si
New market liquidity indicator, more accurate with two levels, will really unhide the "hidden agenda" of the price action in any timeframe. For more information about market liquidity, a manual on how to use this indicator please send me a message. A lot of information can be found on the net. (search liquidity trading/ inner circle trader) https://www.youtube.com/watch?v=yUpDZCbNBRI https://www.youtube.com/watch?v=2LIad2etmY8&amp ;t=2054s https://www.youtube.com/watch?v=wGsUoTCSitY&amp ;t
Liquidity Pools
Filip Maurice Daelman
5 (1)
Dear Traders, check out my new multi level market liquidity indicator :  https://www.mql5.com/en/market/product/73098 Many of you have been trading very good with this indicator, thanks for the support and positive feedbacks ! For more information about market liquidity, a manual on how to use this indicator please send me a message. A lot of information can be found on the net. (search liquidity trading/ inner circle trader) https://www.youtube.com/watch?v=yUpDZCbNBRI https://www.youtube.c
Auswahl:
tsomoney
209
tsomoney 2021.11.09 20:11 
 

this indicator has the potential to be your holy grail when used right. it's a perfect indicator for me.

247stocknow
181
247stocknow 2021.10.19 16:46 
 

I know what Liquidity is, but Need an Manual for your program. Defiantly would have been 5stars but no manual.

educlassic
54
educlassic 2021.01.13 04:12 
 

Add Manual Please

macdours
25
macdours 2020.11.05 00:10 
 

I too purchased the indicator but I am having to try and figure it out on my own, since there is no manual that comes with the indicator. I can see how it could be profitable but I have not used it yet. I have been waiting for the United States elections to finish up. If the seller could respond with a manual that would be extremely helpful.

gijs_best_service
21
gijs_best_service 2020.10.14 18:31 
 

Really good indicator!! Would be awesome to have some kind of manual to understand all the colors. Have been making good profits since using this indicator. Hope seller will respond on chat!

Antwort auf eine Rezension
Version 10.0 2020.07.22
Better accuracy
Version 8.0 2020.07.13
Default set for EUR/USD
Version 7.0 2020.07.10
Bug fixes
Version 6.0 2020.07.08
Updates, bugfixes
Version 5.0 2020.07.05
One indicator with different signals :

- Moving Average bands + difference
- Reversal Blocks
- Liquidity Pools
Version 4.0 2020.07.01
Additional features
Version 3.0 2020.07.01
Addition of reversal signals
Version 2.0 2020.05.08
- Minor fixes
- Possibility to change the color