DWMACD
- Indicadores
- Versión: 1.1
- Actualizado: 23 noviembre 2021
- Activaciones: 5
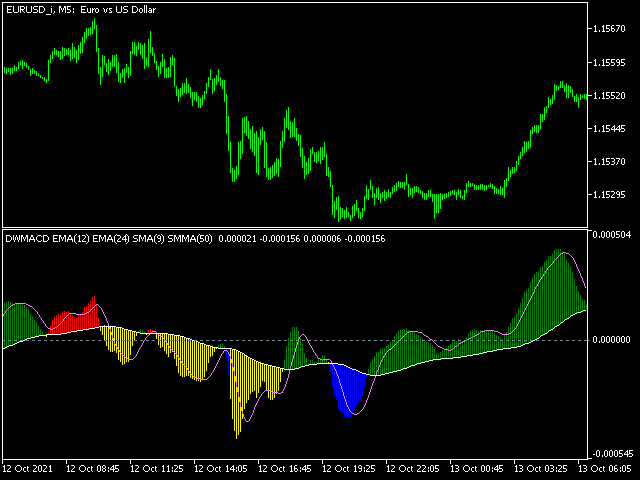
DWMACD - Divergencia Onda MACD. El indicador muestra las divergencias cambiando el color del histograma MACD. El indicador es fácil de usar y configurar.
Para el cálculo se puede utilizar una línea de señal o los valores del histograma MACD estándar. Puede cambiar el cálculo utilizando el parámetro UsedLine. Es aconsejable utilizar una línea de señal para el cálculo si el histograma cambia a menudo de dirección y tiene valores pequeños, formando una especie de plano. Para suavizar los valores del histograma fije la línea de señal en UsedLine y un periodo pequeño (2-5). A medida que aumenta el periodo, el indicador va por detrás del precio (lo que se aplica a cualquier indicador).
El indicador se calcula al precio actual (cierre).
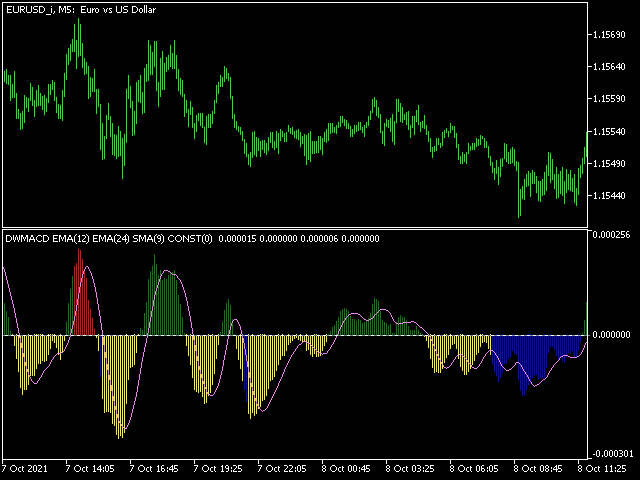
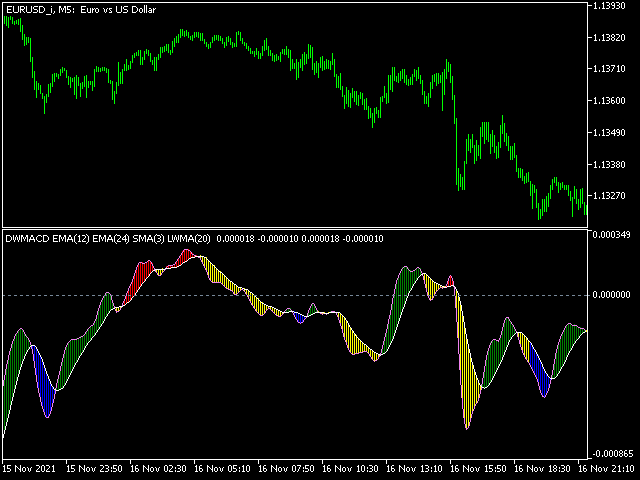
Puede utilizar sus propios valores de media móvil en la configuración. Es posible utilizar 4 tipos estándar de medias móviles (SMA, EMA, LWMA, SMMA). También se introduce el tipo CONST, que es una línea recta (valor constante). Cuando se utiliza CONST, el valor se toma del periodo de la línea especificada. No se puede utilizar CONST para construir el propio MACD. Sólo se puede utilizar cuando se dibuja una línea terminadora. La línea de terminación divide el histograma en partes superior e inferior. En el MACD estándar, ésta es la línea cero. Aquellos. si desea utilizar valores estándar con un terminador cero, utilice el CONST para la línea del terminador con un período de 0. En este indicador, el terminador puede ser una media móvil calculada a partir de la línea calculada base especificada en el parámetro UsedLine. En consecuencia, la divergencia se calcula como la diferencia en la desviación de los picos unidireccionales adyacentes de la línea de terminación.
Las señales de este indicador son señales de divergencia. No se trata necesariamente de una inversión, pero sí de un debilitamiento de la tendencia. Con otras condiciones positivas, vale la pena entrar en el mercado utilizando este indicador cuando la línea de terminación se rompe por una onda divergente, esperando una tendencia larga. También es posible que la divergencia emergente no esté justificada y el precio continúe moviéndose. En el histograma, esto se verá como el color de la divergencia, sustituido por el color de un simple movimiento. En este caso, el movimiento del precio continuará al menos una onda más (por regla general).
Los colores de la divergencia corresponden a lo intuitivo: azul - buscando compras, rojo - ventas.
Nota: ¡la siguiente divergencia anula la anterior!
En mi opinión, el indicador demuestra los mejores resultados con la configuración predeterminada, pero usted puede encontrar los parámetros más adecuados para usted.
¡Que tenga éxito!