KT Pivot Points MT5
- Indikatoren
-
KEENBASE SOFTWARE SOLUTIONS
 Keenbase Trading entwickelt professionelle MetaTrader 4- und MetaTrader 5-Indikatoren sowie Expert Advisors, die Trader dabei unterstützen, fundiertere Handelsentscheidungen zu treffen.
 - Version: 1.5
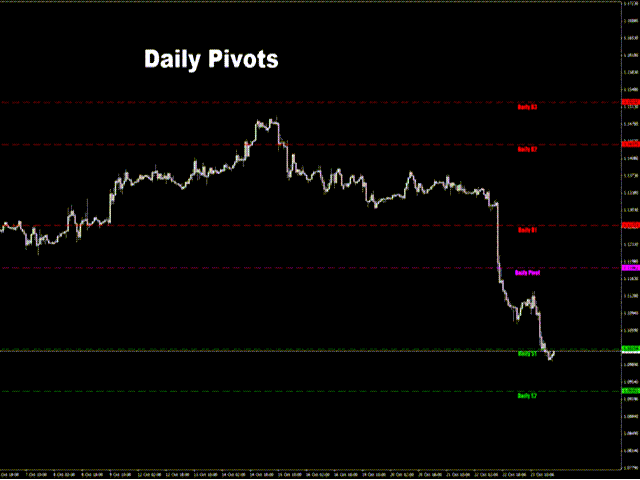
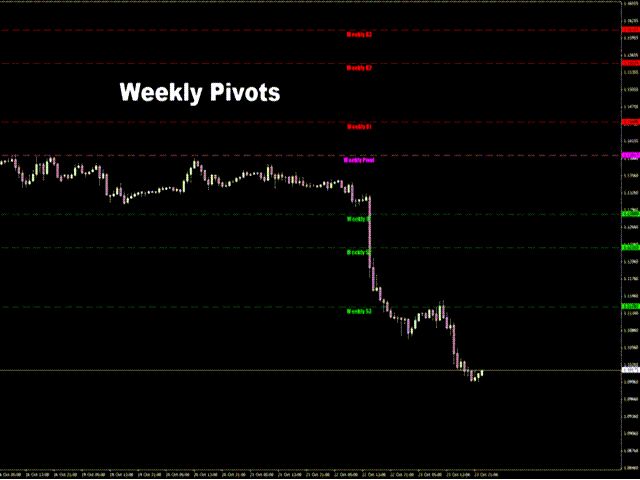
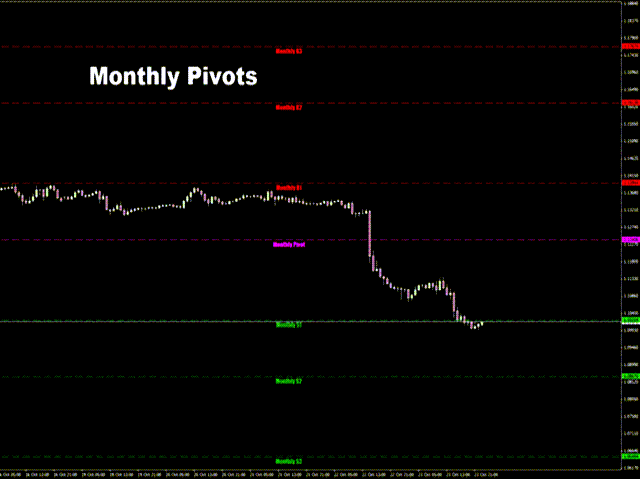
KT Pivot Points zeigt automatisch tägliche, wöchentliche und monatliche Pivot-Level auf dem Chart an, basierend auf den neuesten Marktdaten. Pivot-Punkte sind ein weit verbreiteter Indikator in der technischen Analyse, besonders im Forex-Markt.
Funktionen
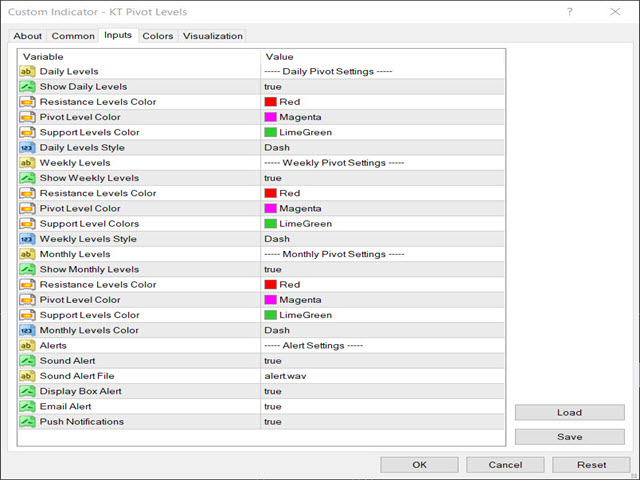
- Sendet Benachrichtigungen, wenn der Preis ein Pivot-Level erreicht.
- Bietet vollständige Anpassungsmöglichkeiten für jede Art von Pivot-Level.
- Zeigt Pivot-Level für täglich, wöchentlich und monatlich klar und übersichtlich an.
- Nutzt minimale CPU-Ressourcen für eine schnelle Berechnung.
- Kompatibel mit anderen Indikatoren auf dem Chart.
Was sind Pivot-Punkte?
Ein Pivot-Punkt wird durch den Durchschnitt von Hoch, Tief und Schlusskurs des vorherigen Handelstags oder der vorherigen Sitzung berechnet.
Anhand der berechneten Pivot-Punkte können Unterstützungs- und Widerstandsniveaus für die Zukunft projiziert werden, um Kursbewegungen um diese Bereiche herum besser einschätzen zu können.
Allgemein gilt: Wird über dem Pivot gehandelt, herrscht bullische Stimmung, unterhalb des Pivots hingegen eine bärische Stimmung.
Pivot-Formel
Zur Berechnung der Pivot-Level werden Hoch, Tief und Schlusskurs vom vorherigen Tag, Woche oder Monat verwendet.
- P = (H + L + C) / 3
- R1 = P + (P − L) = 2×P − L
- S1 = P − (H − P) = 2×P − H
- R2 = P + (H − L)
- S2 = P − (H − L)
- R3 = H + 2×(P − L) = R1 + (H − L)
- S3 = L − 2×(H − P) = S1 − (H − L)
Wobei,
P = Pivot, H = Hoch, L = Tief, C = Schlusskurs
R = Widerstand
S = Unterstützung
Wie man Pivot-Punkte verwendet
Pivot-Level können als Unterstützungs- oder Widerstandszonen genutzt werden, um Umkehrpunkte, Fortsetzungen, Stop-Loss- und Gewinnziele zu bestimmen. Daytrader verwenden oft tägliche Pivot-Level, Swing-Trader wöchentliche und langfristige Investoren monatliche Level.
Positionshändler und Investoren können auch Jahresdaten nutzen, um bedeutende Level für kommende Jahre abzuleiten.
Strategien mit Pivot-Punkten
Typischerweise kaufen Trader, wenn der Preis ein Unterstützungsniveau erreicht, und verkaufen bei einem Widerstand. Doch diese Methode kann in stark trendenden Märkten riskant sein.
Man kann Pivot-Punkte auch intelligenter einsetzen: Wenn der Preis unter dem zentralen Pivot liegt, wird ein Abwärtstrend erwartet, liegt er darüber, ein Aufwärtstrend.
Kein Indikator oder System ist perfekt. Pivot-Punkte können auch mal versagen – dennoch sind sie ein wertvolles Werkzeug zur Orientierung in jeder Handelsstrategie.