Volume Breakout
- Indikatoren
- Version: 2.20
- Aktivierungen: 5

- Die Komplettlösung für die Volumenanalyse auf dem WIN-Markt 📈
🚨 Der Indikator #C3 - [Volumen] wurde speziell für Händler entwickelt, die auf dem brasilianischen Aktienmarkt tätig sind. Wenn Sie ein Händler sind, der nach präzisen und effektiven Strategien für den WIN-Asset sucht, wird dieser Indikator zu einem unverzichtbaren Werkzeug in Ihrem Arsenal. Durch den Einsatz einer eingehenden Analyse des Volumenstroms können Sie Umkehrpunkte oder Trendfortsetzungen auf der Grundlage signifikanter Volumina identifizieren. Die Analyse des Volumens ist eines der mächtigsten Geheimnisse zur Optimierung der Operationen auf dem Finanzmarkt.
Mit #C3 - [Volumen] können Sie ganz einfach das Tick-Volumen oder das tatsächlich gehandelte Volumen in Echtzeit überwachen und gleitende Durchschnitte wie SMA, EMA, SMMA und LWMA verwenden, um Kauf- und Verkaufssignale auf der Grundlage von Volumenausbrüchen zu erzeugen. Diese Art der Analyse ist für den Handel an den Aktien- und Futures-Märkten von entscheidender Bedeutung, da das Volumen einer der besten Indikatoren für die Bestätigung oder Entkräftung von Trends ist.
Darüber hinaus bietet der Indikator anpassbare Warnungen, visuelle Pfeile zur Anzeige von Ein- und Ausstiegspunkten und die Möglichkeit, Warnungen per E-Mail, Popup-Benachrichtigungen und akustische Warnungen zu versenden. Der #C3 - [volume] vereinfacht nicht nur Ihre Analyse, sondern hält Sie auch jederzeit über Chancen auf dem WIN-Markt auf dem Laufenden.
💭 Stellen Sie sich vor, Sie hätten die totale Kontrolle über die Schwankungen des WIN-Marktes mit einem Tool, das Volumen und gleitende Durchschnitte kombiniert, um klare Kauf- und Verkaufssignale zu liefern. Das ist das Ziel von #C3 - [Volumen]! Mit diesem Indikator können Sie selbst bestimmen, wie das Volumen analysiert wird und wie Sie über Signale informiert werden möchten. Der #C3 - [volume] verwandelt den MetaTrader 5 in eine noch leistungsfähigere Plattform, die es Ihnen ermöglicht, fundierte Entscheidungen auf der Grundlage realer Marktdaten zu treffen.
💥 Verpassen Sie keine Chancen mehr auf dem WIN-Markt! Laden Sie jetzt #C3 - [Volumen] herunter und nutzen Sie die Vorteile eines Indikators, der Ihre Trades optimiert. Die Möglichkeit, das Volumen intuitiv zu visualisieren, kombiniert mit flexiblen Warnungen und anpassbaren Einstellungen, wird Sie als Trader am Aktienmarkt hervorheben.
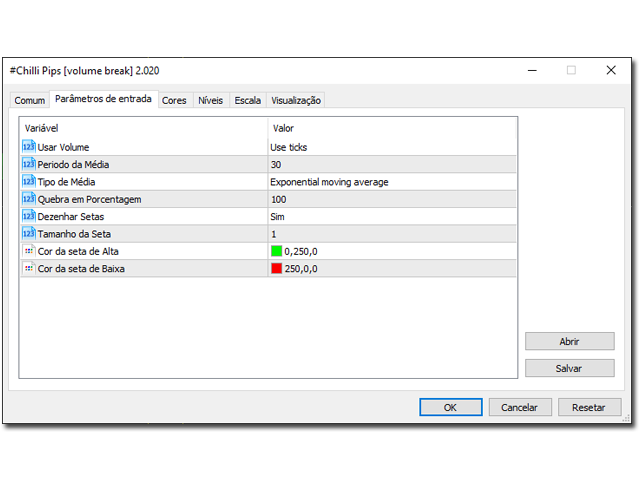
Eingabe-Parameter:
-
inpVolumeType (Volumen-Typ):
-
vol_ticks: Tick-Volumen (Anzahl der Trades).
-
vol_volume (Volumen): Real gehandeltes Volumen (Anzahl der Kontrakte).
-
Voreinstellung: vol_volume .
-
-
inpAveragePeriod (Durchschnittliche Periode):
-
Definiert die Anzahl der Balken, die zur Berechnung des gleitenden Durchschnitts des Volumens verwendet werden.
-
Standardwert: 15 .
-
-
inpAverageMethod (Methode des gleitenden Durchschnitts):
-
ma_sma: Einfacher gleitender Durchschnitt (SMA).
-
ma_ema: Exponentieller gleitender Durchschnitt (EMA).
-
ma_smma: Geglätteter gleitender Durchschnitt (SMMA).
-
ma_lwma: Linear gewichteter gleitender Durchschnitt (LWMA).
-
Voreinstellung: ma_ema .
-
-
inpBreakoutPercent (Prozentsatz des Ausbruchs):
-
Prozentsatz des Volumenanstiegs im Vergleich zum gleitenden Durchschnitt, oberhalb dessen ein Ausbruchssignal erzeugt wird.
-
Voreinstellung: 25% .
-
-
AlertsOn (Alarme aktivieren):
-
INPUT_YES: Aktiviert Alarme für Kauf- und Verkaufssignale.
-
INPUT_NO: Deaktiviert Alarme.
-
Voreinstellung: INPUT_NO .
-
-
AlertsOnCurrent (Alarme bei aktueller Kerze):
-
INPUT_YES: Aktiviert Alarme für die aktuelle Kerze.
-
INPUT_NO: Aktiviert Alarme für die nächste Kerze.
-
Voreinstellung: INPUT_NO .
-
-
AlertsMessage (Warnmeldung):
-
INPUT_YES: Sendet eine Warnmeldung.
-
INPUT_NO: Sendet keine Warnmeldung.
-
Voreinstellung: INPUT_NO .
-
-
AlertsSound (Warnton):
-
INPUT_YES: Spielt einen Ton ab, wenn der Alarm ausgelöst wird.
-
INPUT_NO: Es wird kein Ton abgespielt.
-
Voreinstellung: INPUT_NO .
-
-
AlertsEmail (E-Mail-Warnung):
-
INPUT_YES: Sendet eine E-Mail, wenn der Alarm ausgelöst wird.
-
INPUT_NO: Es wird keine E-Mail gesendet.
-
Voreinstellung: INPUT_NO .
-
-
AlertsNotify (Pop-Up-Benachrichtigung):
-
INPUT_YES: Zeigt eine Popup-Benachrichtigung an.
-
INPUT_NO: Zeigt keine Popup-Benachrichtigung an.
-
Voreinstellung: INPUT_NO .
-
-
InpDrawChartsArrow (Zeichnen von Pfeilen im Diagramm):
-
INPUT_YES: Zeigt Pfeile auf dem Chart für Kauf- oder Verkaufssignale an.
-
INPUT_NO: Zeigt keine Pfeile an.
-
Voreinstellung: INPUT_YES .
-
-
InpArrowSize (Pfeilgröße):
-
WIDTH0: Größe 1.
-
WIDTH1: Größe 2.
-
WIDTH2: Größe 3.
-
WIDTH3: Größe 4.
-
WIDTH4: Größe 5.
-
Voreinstellung: WIDTH0 .
-
-
InpColorBullishArrow (Farbe des bullischen Pfeils):
-
Farbe für den Kaufpfeil (bullish).
-
Voreinstellung: clrLime .
-
-
InpColorBearishArrow (Farbe des Bearish-Pfeils):
-
Farbe für den Verkaufspfeil (bearish).
-
Voreinstellung: clrLime .
-
Vorteile:
-
Präzision beim Erkennen von Gelegenheiten: Durch die Überwachung des Volumens und seiner Beziehung zu gleitenden Durchschnitten bietet #C3 - [volume] einen klaren Überblick darüber, wann das Volumen eine potenzielle Trendumkehr oder -fortsetzung antreibt.
-
Anpassbare Alarme: Stellen Sie visuelle, akustische, Pop-up- oder E-Mail-Warnungen ein, um keine Handelsgelegenheit auf dem WIN-Markt zu verpassen.
-
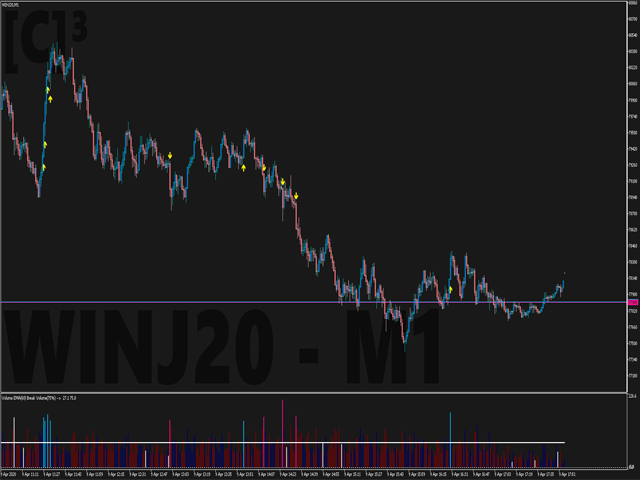
Sofortige Sichtbarkeit: Die grafischen Pfeile machen den Indikator visuell intuitiv und vereinfachen die Identifizierung von Kauf- und Verkaufssignalen direkt auf dem Chart.
-
Perfekt für Trader des brasilianischen Aktienmarktes: Der #C3 - [volume] ist auf den brasilianischen Aktienmarkt fokussiert und ist ideal für diejenigen, die mit dem WIN handeln und die Genauigkeit ihrer Trades im MetaTrader 5 erhöhen möchten.
Mit dem #C3 - [volume] verfügen Sie über ein leistungsfähiges Werkzeug zur Optimierung Ihrer Handelsstrategien im WIN-Markt, indem Sie den Volumenfluss nutzen, um durchsetzungsfähigere Gelegenheiten zu identifizieren und Ihre Finanzergebnisse zu verbessern. Transformieren Sie Ihre Volumenanalyse und bringen Sie Ihre Trades auf die nächste Stufe.