CoioteCandlePVA
- Indikatoren
- Version: 1.0

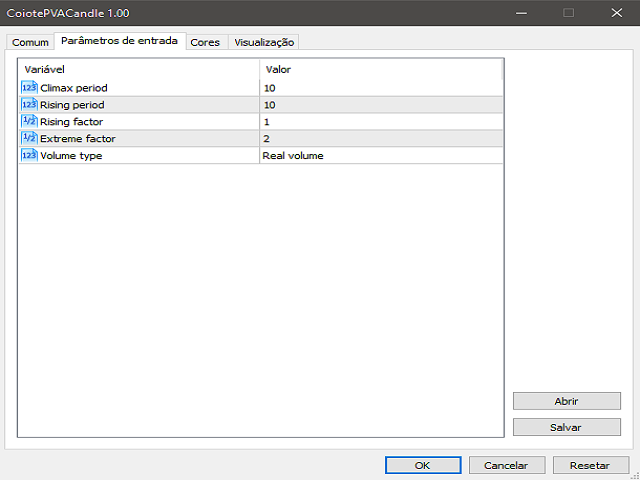
Kerze mit Volumen-Preis-Analyse (VPA) Färbung nach den Definitionen von Anna Coulling, Sie können Höhepunkt und steigende Perioden, extremen Faktor und steigenden Faktor konfigurieren.
Sie können reales Volumen oder Tick-Volumen verwenden.
Die VPA berücksichtigt die Veränderung des Preises durch das Volumen während des Zeitraums und zeigt an, ob eine Bewegung an Dynamik gewinnt, ihren Höhepunkt erreicht hat oder nicht mehr von Interesse ist.

Olá! Poderia comentar sobre a relação das cores e variações de volume? obrigado