HiLoActivator
- Indikatoren
-
Jonathan Pereira
 Como Desenvolvedor de Sistemas dedicado e apaixonado, adoro me aventurar no mundo da programação, tanto profissionalmente quanto em meu tempo livre. Dominando Java, Python e MQL5, minha experiência se estende a outras áreas, como SQL, bancos de dados relacionais e não relacionais, PySpark, Hadoop
 - Version: 1.1
- Aktualisiert: 9 Mai 2021
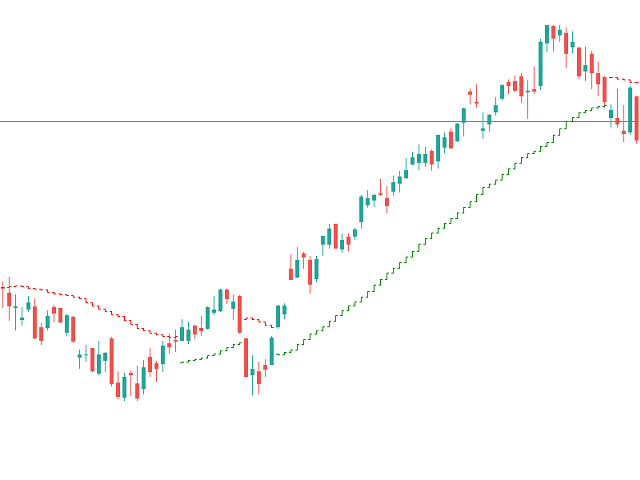
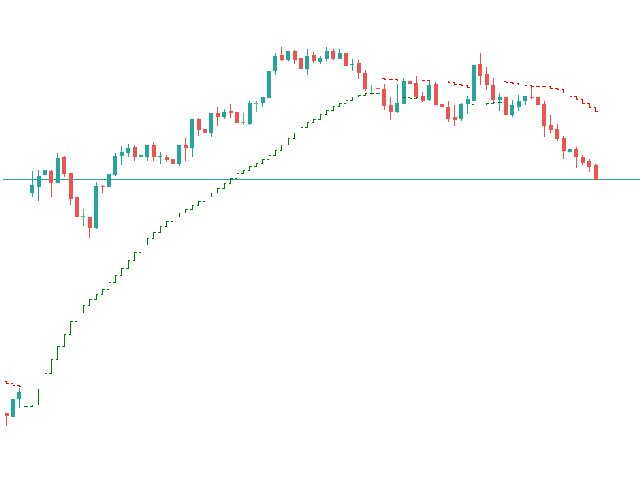
Hi-Lo ist ein Indikator, dessen Ziel es ist, die Entwicklung eines bestimmten Vermögenswerts genauer zu unterstützen und so den besten Zeitpunkt für einen Kauf oder Verkauf anzuzeigen.
Was ist Hi-lo?
Hi-Lo ist ein Begriff aus dem Englischen, wobei Hi mit dem Wort High und Lo mit dem Wort Low verbunden ist. Es handelt sich um einen Trendindikator, der zur Bewertung des Handels mit Vermögenswerten auf dem Finanzmarkt verwendet wird.
Daher wird er verwendet, um festzustellen, ob ein bestimmter Vermögenswert einen Aufwärts- oder Abwärtstrend im Wert aufweist. Auf diese Weise kann der Hi-Lo Activator als Indikator für Auf- und Abwärtstrends übersetzt werden.
Wie funktioniert er?
Hi-lo arbeitet mit einer grafischen Darstellung, die versucht, die Auf- und Abwertungstendenzen eines bestimmten Vermögenswerts aufzuzeigen.
In der grafischen Analyse wird der Indikator durch zwei Linien dargestellt, wobei der Aufwärtstrend in Grün und der Abwärtstrend in Rot angezeigt wird. In diesem Sinne wird jeweils nur eine Linie dargestellt.
Diese Linie liegt unter oder über dem Vermögenswert und folgt somit dem möglichen Trend zu diesem Zeitpunkt. Wenn die untere Linie angezeigt wird, sendet der Indikator ein Kaufsignal, da davon ausgegangen wird, dass der Kurs Anzeichen einer Aufwertung zeigt. Wird hingegen die obere Linie angezeigt, wird ein Verkaufssignal gesendet, da davon ausgegangen wird, dass der Trend dieses Vermögenswerts nach unten geht.


Coloquei o indicador HiLo Activator no código do EA e está funcionando muito bem. Pode baixar