IndicateMe MT4
- Indikatoren
- Version: 1.0
- Aktivierungen: 5
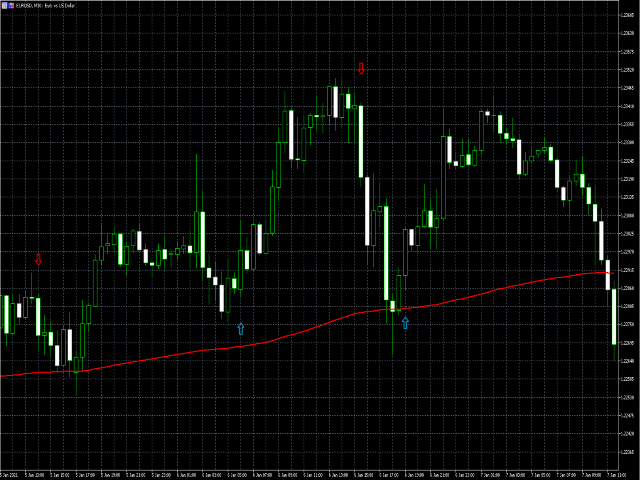
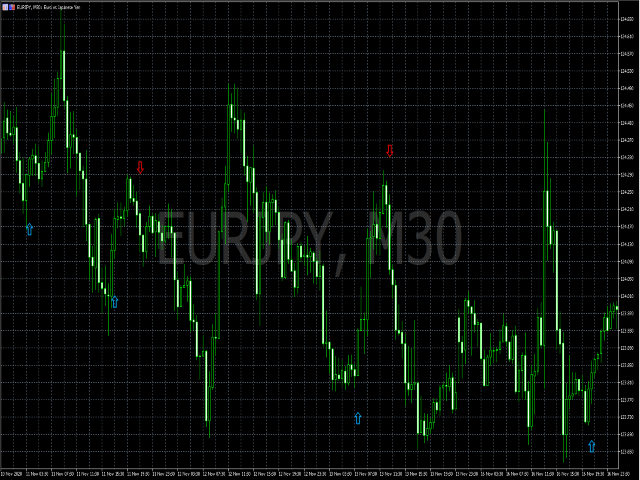
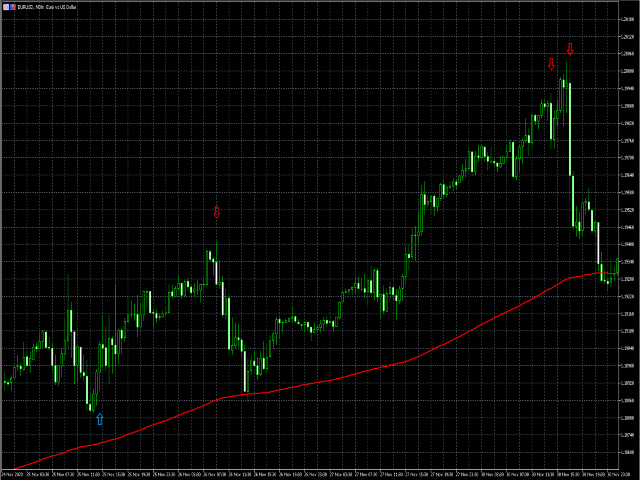
Der IndicateMe-Indikator wurde speziell entwickelt, um so viel Rauschen wie möglich aus den von ihm abgegebenen Signalen zu entfernen.
Der Indikator wurde mit mehreren anderen bekannten Indikatoren kombiniert. Verwendete Indikatoren: "Gleitender Durchschnitt, stokastischer Indikator, relativer Stärkeindex, gleitend".
Alle verwendeten Indikatoren können von Ihnen selbst angepasst werden. Die Standardeinstellungen sind auf die Werte eingestellt, die ich gerne verwende.
Stellen Sie einfach Warnungen ein, um immer über die Signale der Anzeige informiert zu bleiben.

Good indicator. I wish it work on smaller timeframes.