HiLo Points
- Indicadores
- Versión: 1.3
- Actualizado: 14 agosto 2024
- Activaciones: 5

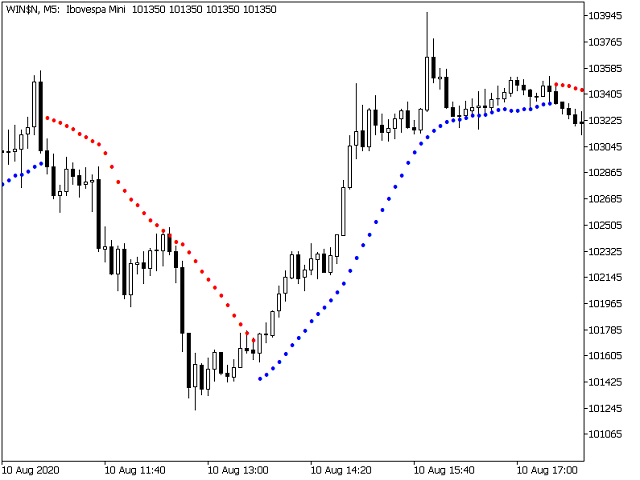
Este indicador se basa en la media móvil del máximo y la media móvil del mínimo para el seguimiento de tendencias y/o trailing stops.
¿Cómo funciona el indicador?
El indicador traza los puntos de la tendencia alcista hasta que se produce un cierre por debajo de la media móvil de los mínimos. Cuando esto ocurre, comienza una tendencia bajista y se traza hasta que se produce un cierre por encima de la media móvil de los máximos. Cuando esto sucede, comienza otra tendencia alcista. Y así sucesivamente.
¿Cómo se utiliza?
- Siguiendo la tendencia: Se puede utilizar como señal de compra cuando los puntos cambian de una tendencia bajista a una alcista. Y también como señal de venta cuando los puntos cambian de una tendencia alcista a una bajista.
- Trailing stop: Puede utilizarlo para seguir su orden de stop loss y asegurar beneficios.
Aviso:
- Diferentes periodos del HiLo funcionan mejor en diferentes pares/acciones y marcos temporales. Experimente y encuentre el que más le convenga.
- El punto puede cambiar entre tendencia alcista y bajista mientras la barra sigue abierta. Así que una señal es válida una vez que la barra actual se cierra y una nueva barra se abre. Por lo tanto, para que los trailing stops basados en el indicador HiLo no se activen hasta que cambie la tendencia, y así maximizar sus beneficios, puede salir de la operación o reforzar su orden de stop loss sólo cuando se cierre una barra invirtiendo los puntos.
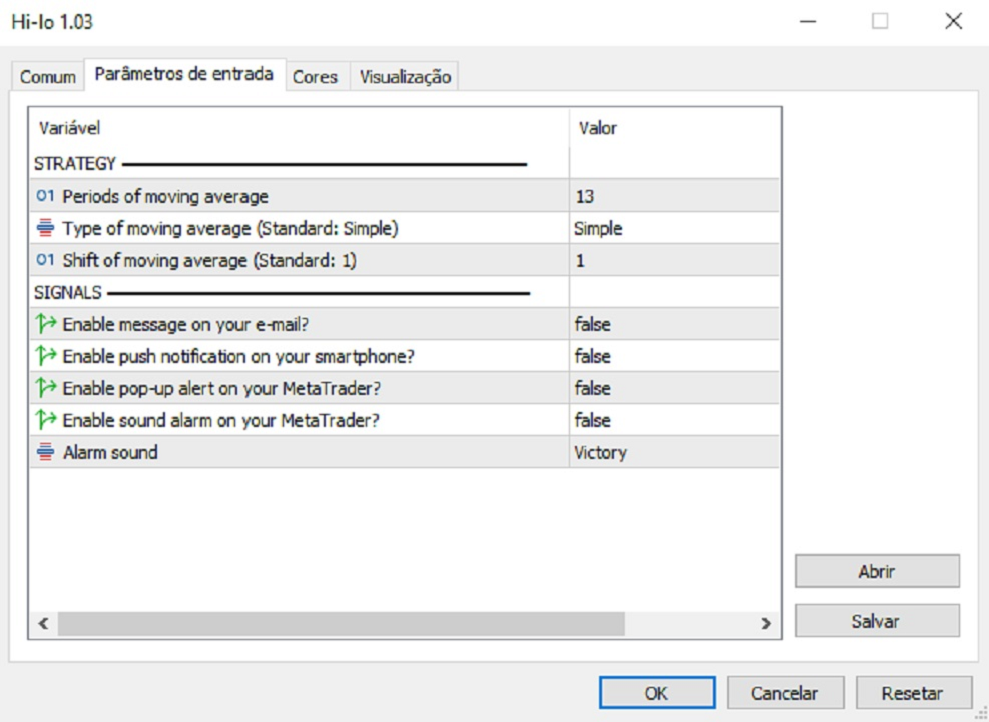
Características que puede editar a su gusto:
- Periodo de la media móvil para los máximos y mínimos.
- Tipo de media móvil.
- Desplazamiento de la media móvil.
- Color y tamaño de los puntos de tendencia alcista. - Color y tamaño de los puntos de tendencia bajista.
> NUEVAS FUNCIONES AÑADIDAS:
Ahora puede ser notificado cuando los puntos cambian de dirección. Ideal para cuando no está mirando el gráfico.
- Activa las notificaciones push en tu smartphone
- Activar alerta emergente en su MetaTrader
- Activar Alarma Sonora en su MetaTrader