BeST Keltner Channels Strategies MT5
- Indikatoren
- Version: 1.10
- Aktivierungen: 10

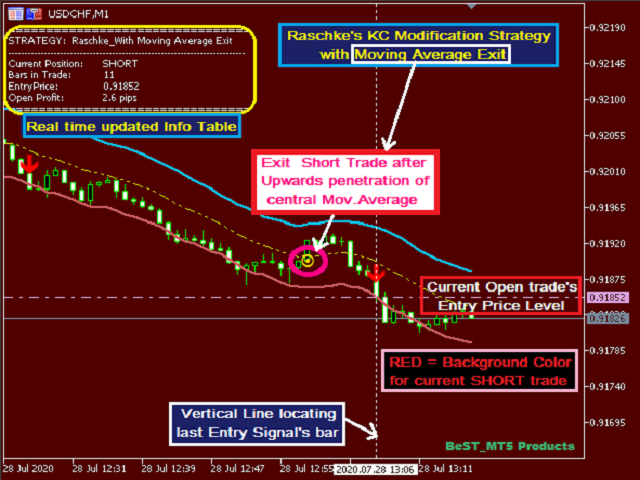
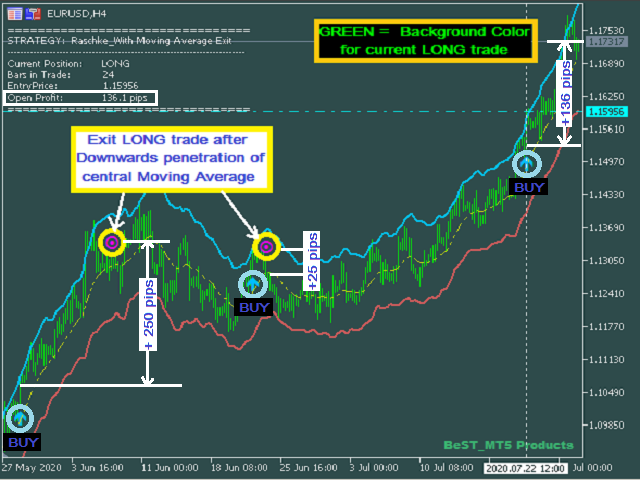
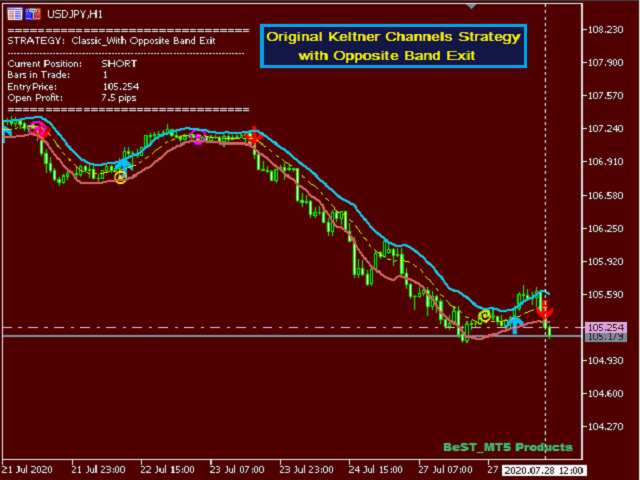
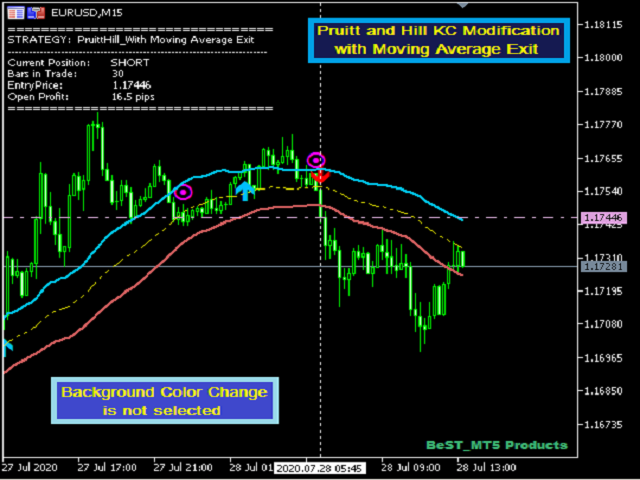
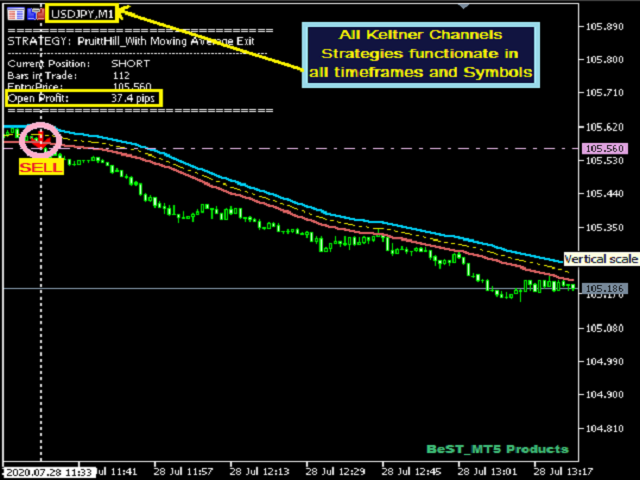
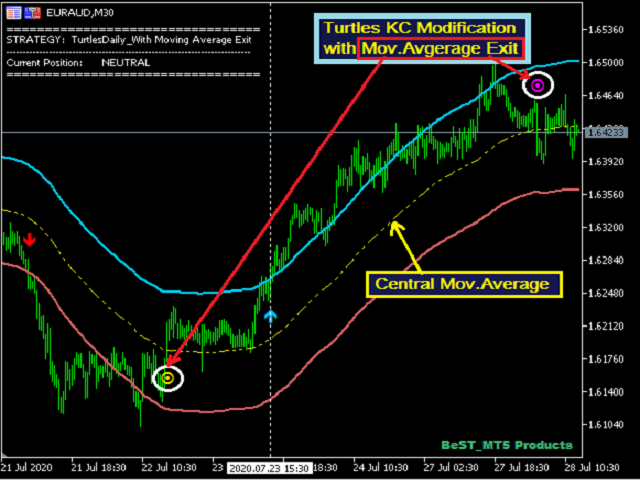
BeST_Keltner Channels Strategies MT5 ist ein MT5-Indikator, der auf dem originalen Keltner Channels-Indikator basiert und alle bekannten Variationen von Keltner Channels sowie die entsprechenden 10 Gesamtstrategien im Chart anzeigen kann. Jeder dieser Kanäle besteht in der Regel aus einer zentralen gleitenden Durchschnittslinie und zwei Begrenzungsbändern in einem Abstand darüber und darunter und kann hauptsächlich in einem Trending Mode, aber auch in einem Ranging ReEntry Mode gehandelt werden.
BeST_Keltner Channels Strategies Indikator
- Zeichnet eindeutige Kauf-/Verkaufspfeile und Ausstiegssignale
- Zeichnet immer erst nach dem Bar-Closing und ist somit nicht-repainting und nicht-backpainting
- Zeigt die entsprechenden Keltner Channels Variationen an
- Zeigt eine in Echtzeit aktualisierte Info-Kommentar-Tabelle an
- Es kann als eigenständiges Handelssystem verwendet werden
- Hat vollständig anpassbare Farben, Größen und Abstände aller Chart-Objekte
- Implementiert alle MT5 Alerts für die Entry- und Exit-Signale
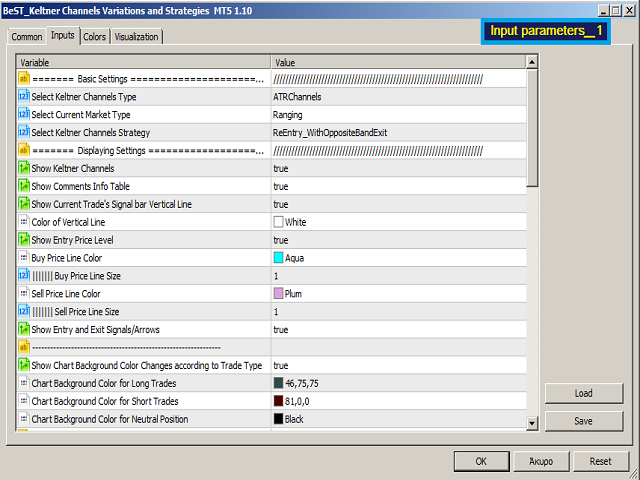
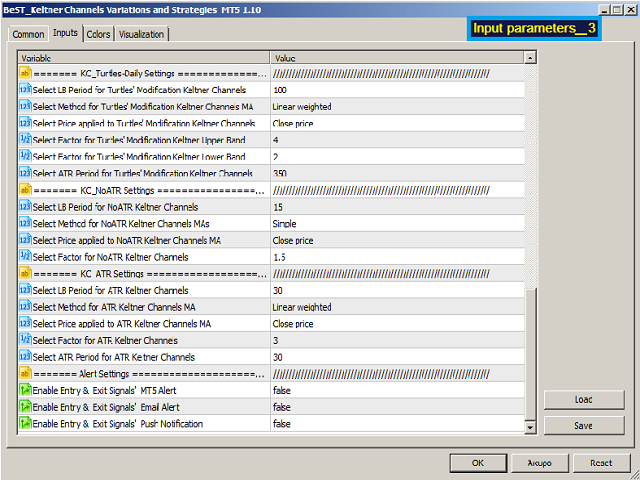
Eingabeparameter
== Grundeinstellungen == Alert Einstellungen - zur Steuerung aller Arten von MT5 Alerts
== Grundeinstellungen
- Wählen Sie den Typ der Keltner-Kanäle
- Wählen Sie den aktuellen Markttyp
- Keltner Channels Strategie wählen
== Anzeigeeinstellungen - zur Auswahl der anzuzeigenden / zu aktivierenden Chart-Objekte und -Funktionen.
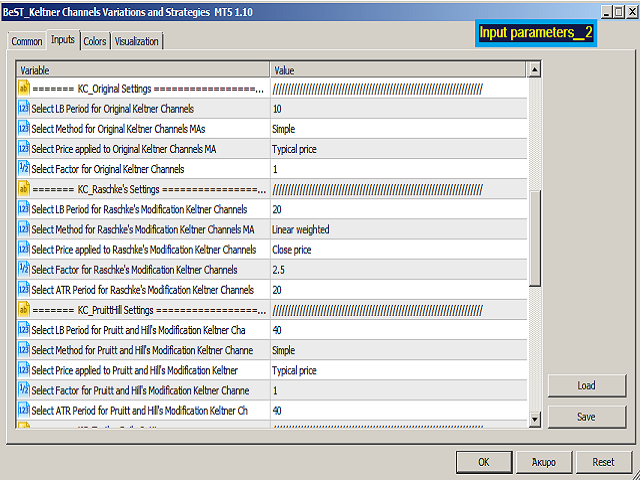
== Jede andere Auswahl bezieht sich auf die Keltner Channels Parameter
- KC_Original Einstellungen
- KC_Raschke's Einstellungen
- KC_PruittHill-Einstellungen
- KC_Turtles-Daily Einstellungen
- KC_NoATR-Einstellungen
- KC_ATR-Einstellungen
Für EA-Entwickler
Kauf-Pfeil: Puffer = 4
Verkaufspfeil: Puffer = 5
Ausstieg Long: Puffer = 6
Ausstieg Short: Puffer = 7


¡Excelente indicador! Muy fácil de instalar y configurar. Las flechas BUY/SELL y las alertas (popup/push/sonido) funcionan perfecto; las señales se confirman al cierre y no repintan. Me gustó la tabla de info en tiempo real y las variantes de Keltner. En mis primeras pruebas (BTCUSD/EURUSD, H1) la lectura de tendencia y las reentradas fueron claras y útiles. ¡Gracias por la calidad y el precio justo! Consulta: ¿existe un **EA** que opere directamente con las señales de este indicador (o alguna integración recomendada)? Y si por la compra hay algún **bonus** (presets/plantillas extra o descuento en otro producto), con gusto lo recibiría. ¡Gracias de antemano!