BeST Keltner Channels Strategies MT5

5
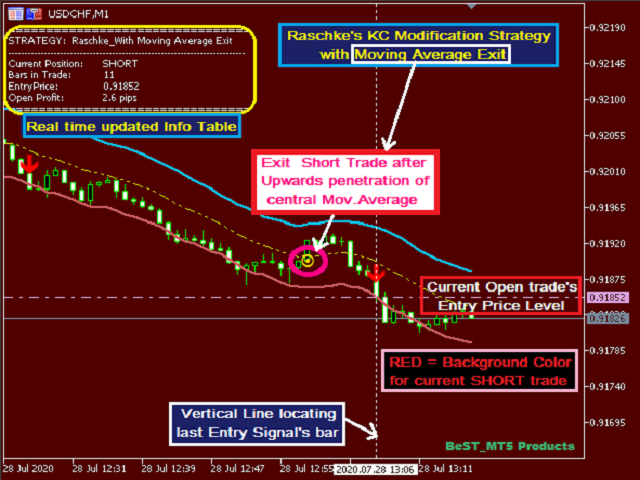
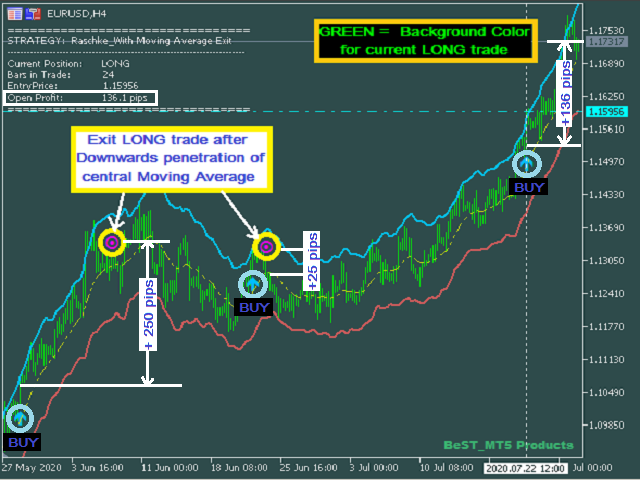
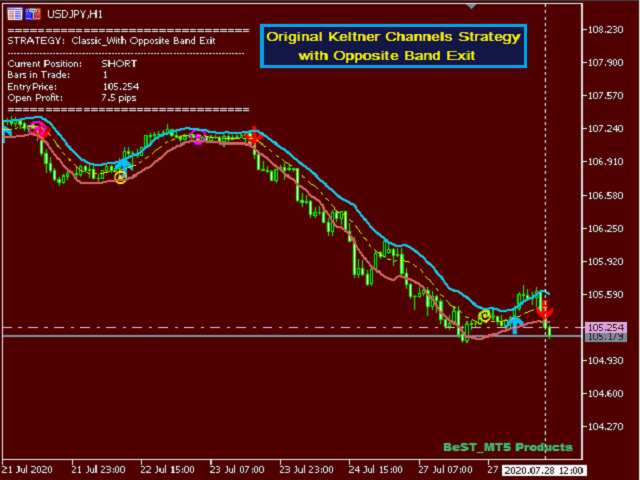
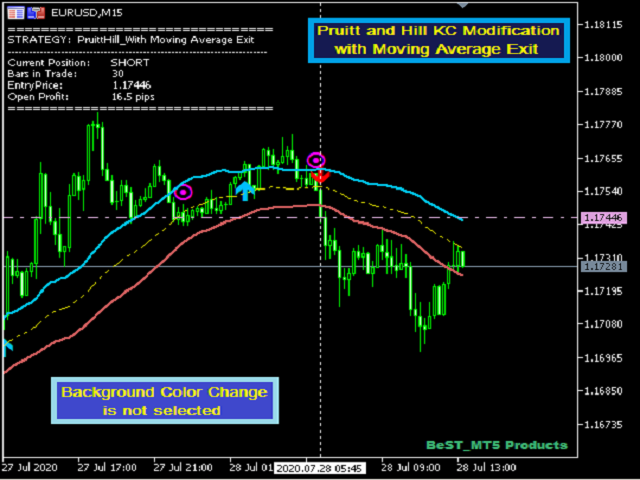
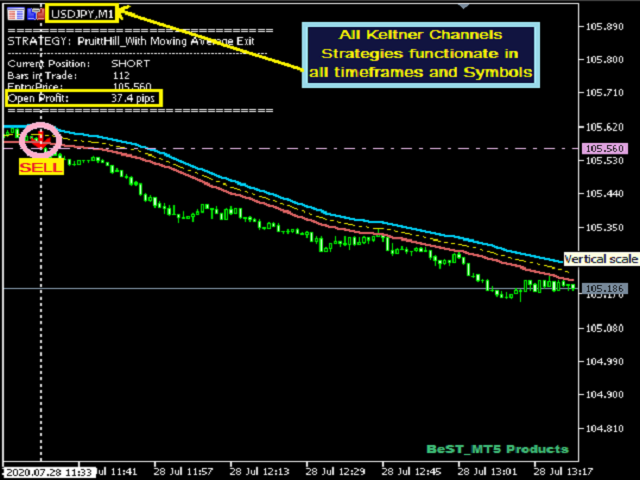
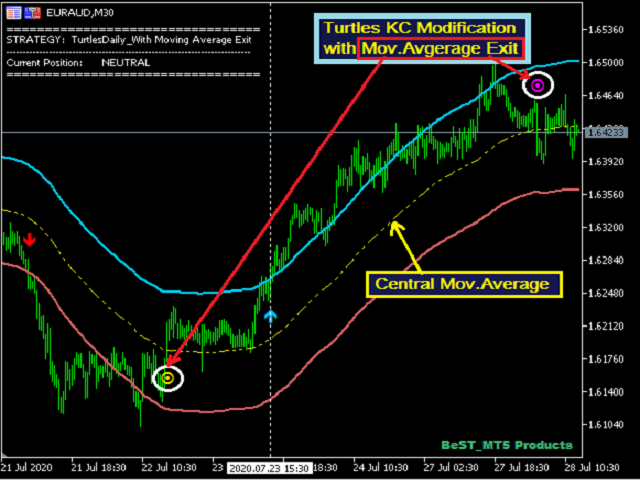
BeST_Keltner Channels Strategies MT5  is an  MT5  Indicator based on the original Keltner Channels Indicator and it can display in the Chart all the known Variations of Keltner Channels and also the corresponding 10 totally Strategies. Every such generally consists of a Central Moving Average Line and two Boundary Bands at a distance above and below it and can be traded mainly in a Trending Mode but also in a Ranging ReEntry Mode. 

BeST_Keltner Channels Strategies Indicator

  • Draws definite Buy/Sell Arrows and Exit Signals
  • Draws always only after the bar closing and so is non-repainting and non-backpainting
  • Displays the corresponding Keltner Channels Variations 
  • Displays a real-time updated Info Comment Table
  • It can be used as a standalone Trading System
  • Has fully customizable colors, sizes & distances of all Chart objects
  • Implements all MT5 Alerts for the Entry and Exit Signals
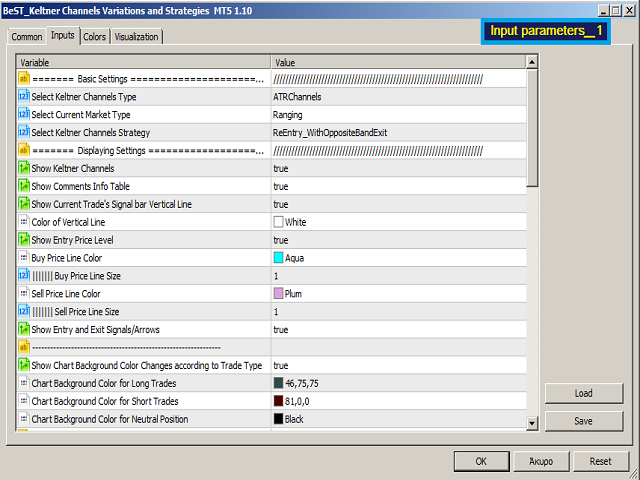
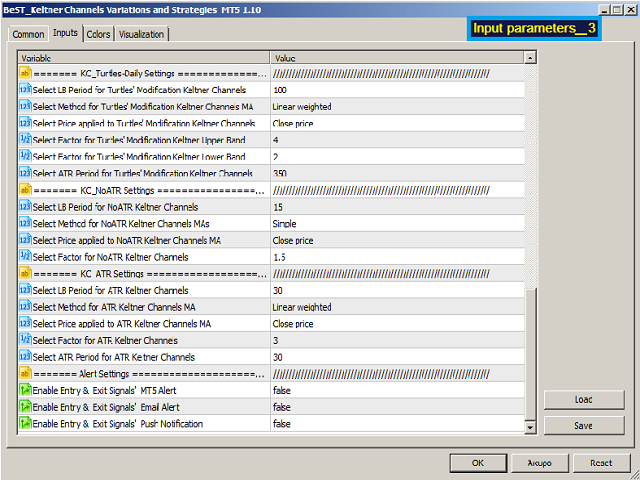
Input parameters

== Basic Settings
  • Select Keltner Channels Type
  • Select Current Market Type
  • Select Keltner Channels Strateg
    == Displaying Settings - for selecting which chart objects and features to show / activate.
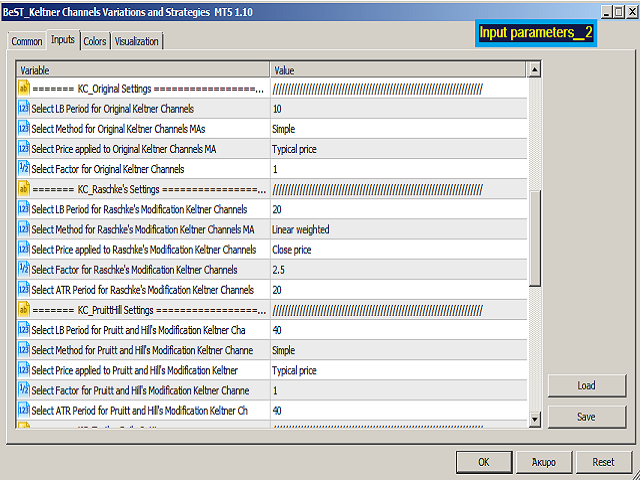
      == Every other selection is related to the Keltner Channels parameters
      •  KC_Original Settings
      •  KC_Raschke's Settings
      •  KC_PruittHill Settings
      •  KC_Turtles-Daily Settings
      •  KC_NoATR Settings
      •  KC_ATR Settings
      == Alert Settings – for controlling all types of MT5 Alerts

      For EA Developers

      Buy Arrow :             Buffer = 4
      Sell Arrow :             Buffer = 5
      Exit Long :              Buffer = 6
      Exit Short :             Buffer = 7


      レビュー 1
      Joan Carlos Rosario Nunez
      515
      Joan Carlos Rosario Nunez 2025.09.02 17:03 
       

      ¡Excelente indicador! Muy fácil de instalar y configurar. Las flechas BUY/SELL y las alertas (popup/push/sonido) funcionan perfecto; las señales se confirman al cierre y no repintan. Me gustó la tabla de info en tiempo real y las variantes de Keltner. En mis primeras pruebas (BTCUSD/EURUSD, H1) la lectura de tendencia y las reentradas fueron claras y útiles. ¡Gracias por la calidad y el precio justo! Consulta: ¿existe un **EA** que opere directamente con las señales de este indicador (o alguna integración recomendada)? Y si por la compra hay algún **bonus** (presets/plantillas extra o descuento en otro producto), con gusto lo recibiría. ¡Gracias de antemano!

      おすすめのプロダクト
      Keltner Channel Indicator Keltner Channel is an oscillator like Bollinger Bands. Keltner Channel is a very good tool to time entries for your strategy. Keltner Channel displays a channel where price is supposed to stay unless we are in overbought or oversold situations. Various strategies use Keltner Channel indicator successfully to spot overbought / oversold situations and look for reversals. Keltner Channel indicator uses ATR to determine overbought and oversold situations. Inputs of the indi
      Ichimoku Aiko MTF
      Michael Jonah Randriamampionontsoa
      Ichimoku Aiko MTF is a collection of technical indicators that show support and resistance levels, as well as momentum and trend direction. It is a multi-timeframe indicator so you don't need to change the chart timeframe when you want to see the ichimoku clouds on a higher timeframe.  eg. The chart timeframe is M15 and you want to see on the M15 timeframe chart the H1 ichimoku indicators (the ichimoku in Metatrader can't do that) that's why you need to use Ichimoku Aiko MTF.
      RBreaker Gold Indicatorsは、金先物の短期日内取引戦略であり、トレンドフォローと日内反転の2つの取引手法を組み合わせたものです。トレンド相場での利益を捉えるだけでなく、相場が反転した際には迅速に利確し、その流れに沿ってポジションを反転させることができます。 この戦略は、アメリカの雑誌『Futures Truth』において、15年連続で最も収益性の高い取引戦略トップ10に選ばれた実績を持ち、非常に長いライフサイクルを誇り、現在も国内外で広く使用・研究されています。 本インディケーターは、2026年の金先物の値動きに対応し、14日間のATR指標に基づいて、ブレイクアウト係数A、観察係数B、リバーサル係数Rをより合理的な値で定義しています。非常に優れたインディケーターであり、安定的な年間収益を実現しています。ぜひおすすめします〜
      K_Channel is a technical indicator defining the current Forex market status - trend or flat. The indicator works on any timeframe. H1 and higher timeframes are recommended though to minimize false signals. The indicator is displayed as lines above and below EMA. Average True Range (ATR) is used as bands' width. Therefore, the channel is based on volatility. This version allows you to change all the parameters of the main Moving Average. Unlike Bollinger Bands that applies the standard deviation
      This is Gekko's Cutomized Relative Strength Index (RSI), a customized version of the famous RSI indicator. Use the regular RSI and take advantage two entry signals calculations and different ways of being alerted whenever there is potential entry or exit point. Inputs Period: Period for the RSI calculation; How will the indicator calculate entry (swing) signals: 1- Produces Exit Signals for Swings based on RSI entering and leaving Upper and Lower Levels Zones; 2- Produces Entry/Exit Signals for
      it depends on ATR period to get swing points to help make better trading decisions  blue dot and red dot is the default color scheme of course you can change it later if you'd like  you can change the following : ATR PERIOD  sending notifications number of times to send notifications  sending notifications to your smart phone that's it very simple to use just drag and drop and follow the trend 
      ZLMA Trend Candles indicator uses an enhanced Zero-Lag Moving Average to highlight key trend shifts, repainting candles in real time. It reacts faster than traditional moving averages, helping you spot potential market turns earlier. Gain clear entry and exit signals and filter out market noise with ease! This product is also available for MetaTrader 4 =>  https://www.mql5.com/en/market/product/129279 1. What Is ZLMA Trend Candles? ZLMA Trend Candles is a MetaTrader 4/5 indicator based on the Z
      Market Trend Indicator Analog Copyright 2025, Jose María Molina Sánchez molinatrader67@gmail.com | バージョン 1.00 導入 Market Trend Indicator Analog は、リアルタイムで市場のトレンドの強さと方向を測定する高度なインジケーターです。従来のオシレーターとは異なり、このインジケーターは市場の状況に動的に応答する適応フィルタリングシステムを使用し、-100から+100までの正確なアナログ表現を提供します。 その設計により、トレーダーはトレンドの開始と終了だけでなく、その強さも特定でき、より情報に基づいた意思決定を行い、過早または遅れたエントリーを避けることができます。 インジケーターの動作方法 このインジケーターは、独自のアルゴリズムに基づいており、価格のボラティリティに敏感な連続的な信号を生成するために複数の分析手法を組み合わせています。結果は3つの方法で表示されます: 別ウィンドウで: -100(最大の弱気勢力)から+100(最
      CosmiCLab SMC FIBO CosmiCLab SMC FIBO is a professional trading indicator designed for traders who use Smart Money Concepts (SMC), market structure analysis and Fibonacci retracement levels. The indicator automatically detects market swings and builds Fibonacci levels based on the latest impulse movement. It also identifies market structure changes such as BOS (Break of Structure) and CHOCH (Change of Character), helping traders understand the current market direction. CosmiCLab SMC FIBO also pr
      All about time and price by ICT. This indicator provides a comprehensive view of ICT killzones, Silver Bullet times, and ICT Macros, enhancing your trading experience.  In those time windows price either seeks liquidity or imbalances and you often find the most energetic price moves and turning points. Features: Automatic Adaptation: The ICT killzones intelligently adapt to the specific chart you are using. For Forex charts, it follows the ICT Forex times: In EST timezone: Session: Asia: 20h00-0
      The RSI Divergence + FVG Signal indicator combines Relative Strength Index (RSI) Divergence with Fair Value Gap (FVG) detection to generate high-probability buy and sell signals based on both momentum shifts and institutional imbalance zones. Core Features: RSI Divergence Detection : Identifies both regular and hidden bullish/bearish divergences between price and RSI. Divergences indicate potential trend reversals or continuation. FVG Zone Recognition : Detects Fair Value Gaps (imbalances caused
      TRD Trend Range Detector MT5 — Market Regime Identification Indicator TRD Trend Range Detector MT5 is a technical analysis tool designed to identify market regimes. The indicator distinguishes between trending and consolidating (ranging) markets in real-time using a multi-factor algorithm. Market Regime Identification Many trading strategies are dependent on specific market conditions. TRD Trend Range Detector MT5 serves as a filter to identify when a trend is established or when the market is e
      Liquidity Touch Zones PRO X - is   a support and resistance indicator that identifies   price areas of confirmed strength   formed by repeated price interactions and displayed taking into account the instrument's characteristic volatility. The calculation is based on fractal points, which serve as initial benchmarks. These points form price zones reflecting repeated price interactions and are represented as areas of varying heights depending on the level's significance. It is designed for trader
      Tma Poc Gold
      Ignacio Agustin Mene Franco
      POC + TMA SCALPER GOLD - Expert Advisor Professional DESCRIPTION: Automated trading system designed specifically for XAU/USD, combining Point of Control (POC) with Triangular Moving Average (TMA) to identify high-volume and trending zones. It uses advanced risk management with dynamic trailing stops and an intelligent grid system. TECHNICA
      Price Magnet — Price Density and Attraction Levels Indicator Price Magnet is a professional analytical tool designed to identify key support and resistance levels based on statistical Price Density. The indicator analyzes a specified historical period and detects price levels where the market spent the most time. These zones act as “magnets,” attracting price action or forming a structural base for potential reversals. Unlike traditional Volume Profile tools, Price Magnet focuses on price-time d
      The Slope indicator   measures the slope of a linear regression , which is the line of best fit for a data series. A 20-period Slope, therefore, measures the slope of a 20-day linear regression. ... In general, a positive slope indicates an uptrend, while a negative slope indicates a downtrend. How do you use slope Indicator? By applying the slope indicator  to both the price chart and the price relative , chartists can quantify the price trend and relative performance with one indicator. A pos
      ATrend
      Zaha Feiz
      4.83 (18)
      ATrend: その仕組みと使い方 仕組み MT5プラットフォーム向けの「ATREND」インジケーターは、テクニカル分析手法の組み合わせを利用して、トレーダーに堅牢な買いと売りのシグナルを提供するように設計されています。このインジケーターは主に、ボラティリティ測定のために平均真の範囲(ATR)を活用し、潜在的な市場動向を特定するためのトレンド検出アルゴリズムを併用しています。 購入後にメッセージを残すと、特別なボーナスギフトが贈呈されます。 主な特徴: - ダイナミックなトレンド検出: インジケーターは市場トレンドを評価し、シグナルを適宜調整することで、トレーダーが優位な市場環境に合わせて戦略を立てるのを支援します。     - ボラティリティ測定: ATRを使用することで、インジケーターは最適なストップロス(SL)とテイクプロフィット(TP)レベルを決定するために不可欠な市場ボラティリティを測定します。 - シグナルの視覚化: インジケーターは、チャート上に買いと売りのシグナルを視覚的に表示することで、トレーダーの意思決定を強化します。 操作手順 入力とセッティング - TimeF
      This indicator can be considered as a trading system. It offers a different view to see the currency pair: full timeless indicator, can be used for manual trading or for automatized trading with some expert advisor. When the price reaches a threshold a new block is created according to the set mode. The indicator beside the Renko bars, shows also 3 moving averages. Features renko mode median renko custom median renko 3 moving averages wicks datetime indicator for each block custom notification
      Noize Absorption Index - is the manual trading system that measures the difference of pressure between bears forces and bulls forces. Green line - is a noize free index that showing curent situation. Zero value of index shows totally choppy/flat market.Values above zero level shows how powerfull bullish wave is and values below zero measures bearish forces.Up arrow appears on bearish market when it's ready to reverse, dn arrow appears on weak bullish market, as a result of reverse expectation.
      KDJ Index 4   交易实用必备工具指标 波浪自动计算指标,通道趋势交易 完美的趋势-波浪自动计算通道计算 , MT4版本 完美的趋势-波浪自动计算通道计算 , MT5版本 本地跟单复制交易 Easy And Fast Copy , MT4版本 Easy And Fast Copy , MT5版本 本地跟单复制交易 模拟试用 Easy And Fast Copy , MT4 模拟账号运行 Easy And Fast Copy , MT5 模拟账号运行 "Cooperative QQ:556024  "  "Cooperation wechat:556024"  "Cooperative email:556024@qq.com" 强烈推荐趋势指标, 波浪的标准自动计算   和   波浪的标准自动计算MT5版本     KDJ指标又叫 随机指标 ,是一种相当新颖、实用的技术分析指标,它起先用于期货市场的分析,后被广泛用于股市的中短期趋势分析,是期货和股票市场上最常用的技术分析工具。 随机指标KDJ一般是用于股票分析的统计体系,根据统计学原理,通过一个特定的周期(常为9日、9周等)
      This is an advanced multi-timeframe version of the popular Hull Moving Average (HMA) Features Two lines of the Hull indicator of different timeframes on the same chart. The HMA line of the higher timeframe defines the trend, and the HMA line of the current timeframe defines the short-term price movements. A graphical panel with HMA indicator data from all timeframes at the same time . If the HMA switched its direction on any timeframe, the panel displays a question or exclamation mark with a tex
      このインジケーターは、H.M.Gartley (「株式市場の利益」、1935 年) の開発に従って調和パターン (XABCD) を識別します。 D 点を透視投影の点として投影します (設定で ProjectionD_Mode = true を指定します)。 再描画はしません。 作業時間枠のバーが閉じるとき、特定されたパターン ポイントが Patterns_Fractal_Bars バーの間に移動していない場合、チャート上に (予想される価格変動の方向に) 矢印が表示されます。 この瞬間から、矢印はチャート上に永久に残ります。 連続した 2 ~ 3 つ以上の矢印 - これは市場状況の変化であり、再描画/再描画ではありません (時間枠を前後に切り替えてはなりません)。 注: 2 ~ 3 つ以上の矢印が連続している場合 - これは市況の変化であり、再描画ではありません。 パターンの総数は 85 です (Gartley-222 と Gartley-222WS を含む。完全なリストはコメント セクションにあります)。 識別されたすべてのパターンのうち、最後に識別されたパターンのみがベ
      Terra Infinity is a flat indicator. This improved version of the CalcFlat indicator has three additional lines that significantly increase its effectiveness. Unlike its predecessor with two static levels, Terra Infinity adds three dynamic lines above the main histogram, which are interpreted as follows: base signal line, minimum signal line, maximum signal line. These lines are formed using the additional parameter Avg, which is the average value of the histogram. Averaging produces a line cl
      STRICTLY FOR BOOM INDEX ONLY!!!!! Here I bring the Maximum Trend Arrows OT1.0 MT5 indicator. This indicator is made up of a combination of different trend indicators for entries and exits, for entries an orange arrow will paint on the chart below the current market and a red flag for closing of trades and it produces buy arrows only. When the orange arrow appears, it will appear along with it's sound to notify you. The 1H timeframe is recommended, don't use it anywhere else than on the 1H timefr
      Candlestick Pattern Scanner Pro — Indicator Description A comprehensive, customizable candlestick pattern recognition tool for MetaTrader 5, featuring ATR-based signal positioning, dynamic TP/SL levels, and multi-timeframe alert capabilities. Key Features ATR-Based Signal Management ATR Period & Multiplier : Dynamically calculates arrow signal distance based on market volatility. Dynamic TP/SL Levels : Set Take-Profit (TP1/TP2) and Stop-Loss levels using customizable ATR multipliers for
      STRUCTURAL TREND LINES - MT5 Indicator Simple indicator that automatically draws trend lines based on market structure. Features: - 3 degrees of structure detection (short, medium, long term) - Configurable swing strength for each degree - Single color per degree for clean visualization - Adjustable number of lines per degree - Customizable colors and line widths How it works: The indicator identifies swing highs and lows based on the strength parameter, then connects these points to create t
      Divergent Stochastic Filter II Catch Reversals Early, Filter Noise, Trade with Confidence The Edge: Why This Stochastic is Different  Every trader knows the Stochastic oscillator. But knowing when to trust its signals, that's the real challenge. The Divergent Stochastic Filter II transforms this classic indicator into a precision reversal detection system by adding critical elements: divergence intelligence, signal filtering and exhaustion detection.  While standard Stochastic oscillators fire s
      Precision Arrows – TPとSLを内蔵したスマートエントリーシグナル Precision Arrows は、 正確性・明瞭性・信頼性 を求めるトレーダーのために設計された高性能トレーディングインジケーターです。 高確率の買い・売りシグナルを検出し、自動的に テイクプロフィット(TP) と ストップロス(SL) のレベルを設定。 FX・株価指数・暗号資産・シンセティックインデックス など、あらゆる市場で規律的かつ一貫したトレードをサポートします。 このインジケーターは、精密なシグナル検出、インテリジェントなフィルタリング、そしてマルチタイムフレームトレンドダッシュボードを組み合わせ、あらゆる相場環境に対応する完全なトレーディングソリューションを提供します。 期間限定オファー Precision Arrows は現在、 75ドル(永久ライセンス) でご利用可能です。 (通常価格: 199.99ドル / オファー延長中) 重要: ご購入後すぐにご連絡ください。使用手順と 特別ボーナス をお送りします。 主な機能 3つのトレードモード お好みのスタイルに合わせて、 スキャルピ
      The IndicateMe indicator has been specially created to remove as much noise as possible from the signals it gives. The indicator has been combined with several other well-known indicators. Indicators  that have been used: "Moving average, stocastic indicator, relative strenght index, moving". All indicators that are used can be adjusted by yourself. The default settings are set to the values ​​I like to use. Easily set alerts to always stay informed of the indicator's signals. Important: this
      このプロダクトを購入した人は以下も購入しています
      SuperScalp Pro
      Van Minh Nguyen
      4.59 (22)
      SuperScalp Pro – 高度なマルチフィルタースキャルピングインジケーターシステム SuperScalp Pro は、クラシックな Supertrend と複数のインテリジェント確認フィルターを組み合わせた高度なスキャルピングインジケーターです。M1 から H4 まで複数の時間足で効率的に動作し、XAUUSD、BTCUSD、主要 Forex 通貨ペア向けに最適化されています。 このインジケーターは明確な Buy / Sell シグナルを提供し、ATR に基づいてエントリー価格、Stop Loss、Take Profit を自動計算します。Fibonacci Take Profit 機能により、重要な価格帯で早期決済し、到達時に通知を送信します。 初期設定では Fibonacci Take Profit が有効化されており、より安定した取引体験を重視しています。チャートに適用するだけですぐ利用可能です。上級者向けに、すべてのパラメータは自由にカスタマイズできます。 EMA、RSI、ADX、Volume、VWAP、Bollinger Bands、MACD Divergence な
      Entry In The Zone and SMC Multi Timeframe is a real-time 2-in-1 market analysis tool that combines market structure analysis and a No Repaint BUY / SELL signal system into a single indicator, built on Smart Money Concepts (SMC) — a widely adopted framework used by professional traders to understand market structure. This indicator helps you see the market more clearly, make decisions based on structure rather than guesswork, and focus on high-probability zones where price is more likely to react
      SignalTech MT5 is a trading system for EURUSD, USDCHF, USDJPY, AUDUSD, NZDUSD, EURJPY, AUDJPY, NZDJPY, CADJPY H2 and H3 Timeframe.  It can generate signals with Buy/Sell Arrows and Pop-Up/Sound Alerts. Each signal has clear Entry and Stop Loss levels, which should be automatically flagged on the chart, as well as potential Targets 1, 2, and 3. The Entry and TP levels are fixed after the trade is taken. The exit level is dynamic. If there are signs of a potential short-term trend reversal, the
      このインジケーターを購入された方には、以下の特典を 無料 で提供しています: 各トレードを自動で管理し、ストップロスとテイクプロフィットを設定し、戦略ルールに基づいてポジションを決済する補助ツール 「Bomber Utility」 様々な銘柄に合わせたインジケーターの設定ファイル(セットファイル) 「最小リスク」、「バランスリスク」、「待機戦略」 の3つのモードで使用できる Bomber Utility 用の設定ファイル このトレーディング戦略をすぐに導入・設定・開始できる ステップバイステップのビデオマニュアル ご注意: 上記の特典を受け取るには、MQL5のプライベートメッセージシステムを通じて販売者にご連絡ください。 オリジナルのカスタムインジケーター 「Divergence Bomber(ダイバージェンス・ボンバー)」 をご紹介します。これは、MACDのダイバージェンス(乖離)戦略に基づいた 「オールインワン」型のトレーディングシステム です。 このテクニカルインジケーターの主な目的は、価格とMACDインジケーターの間に発生するダイバージェンスを検出 し、将来の価格の動きを示す
      Power Candles V3 - 自己最適化型強弱インジケーター Power Candles V3は 、通貨や銘柄の強さを、適用されたすべてのチャート上で実行可能なトレードプランに変換します。単にローソク足を色分けするだけでなく、バックグラウンドでリアルタイムの自動最適化を実行し、目の前の銘柄に対して最適なストップロス、テイクプロフィット、およびシグナルの閾値を提示します。ワンクリックで実取引に適用でき、エントリーポイント、ストップロス、テイクプロフィットのラインが正確な価格位置にチャート上に表示され、方向性を示すアラートがリアルタイムで発動します。 このツールは、Stein Investmentsのエコシステムの一部です。  18種類以上のツールをすべて閲覧し、AIを活用したセットアップの推奨事項を入手し、  https://stein.investments でコミュニティに参加しましょう クローズしたバーごとに3,000回以上のトレードシミュレーション。9つの強さの状態。2つの戦略を並行してテスト。勝率の高い設定をワンクリックで適用。 なぜこれが必要なのか ほとんどの強
      FX Trend NG:次世代マルチマーケット・トレンドインテリジェンス 概要 FX Trend NG は、複数の時間足に対応したプロフェッショナル向けトレンド分析およびマーケット監視ツールです。 市場全体の構造を数秒で把握することができます。 複数のチャートを切り替える必要はありません。どの銘柄がトレンド中なのか、どこでモメンタムが弱まっているのか、そしてどの時間足で強い整合性があるのかを瞬時に確認できます。 ローンチ特別オファー – FX Trend NG を $30(6ヶ月) または $80 永久ライセンス でご利用いただけます。 すでに Stein Investments のユーザーですか? -> メッセージを送信 して、プライベートグループへアクセスしてください。 セットアップや詳細情報が必要ですか? -> Stein Investments 公式ページ をご覧ください。 1. FX Trend NG が他と異なる理由 3ステート・トレンドロジック ― Buy と Sell だけではない • 多くのインジケーターは Buy または Sell の2状態のみを表示します。
      このインジケーターを購入すると、プロ仕様のトレードマネージャーを無料で差し上げます。 まず第一に、このトレーディングシステムがノンリペイント、ノンリドロー、ノンラグのインジケーターであることを強調する価値がある。これにより、手動取引とロボット取引の両方に理想的なものになっています。 オンラインコース、マニュアル、プリセットのダウンロード。 「スマートトレンドトレーディングシステム MT5」は、新規および経験豊富なトレーダー向けにカスタマイズされた包括的なトレーディングソリューションです。10以上のプレミアムインジケーターを組み合わせ、7つ以上の堅実なトレーディング戦略を備えており、多様な市場状況に対応する多目的な選択肢となっています。 トレンドフォロー戦略:トレンドを効果的に乗り越えるための正確なエントリーとストップロス管理を提供します。 リバーサル戦略:潜在的なトレンドの反転を特定し、トレーダーがレンジ相場を活用できるようにします。 スキャルピング戦略:高速で正確なデイトレードおよび短期取引のために設計されています。 安定性:すべてのインジケーターはノンリペイント、ノンリドロー、ノ
      優れたテクニカルインジケーター「Grabber」をご紹介します。これは、すぐに使える「オールインワン」トレーディング戦略として機能します。 ひとつのコードに、市場のテクニカル分析ツール、取引シグナル(矢印)、アラート機能、プッシュ通知が強力に統合されています。 このインジケーターを購入された方には、以下の特典を無料で提供します: Grabberユーティリティ:オープンポジションを自動で管理するツール ステップバイステップのビデオマニュアル:インジケーターのインストール、設定、取引方法を解説 カスタムセットファイル:インジケーターをすばやく自動設定し、最大限の成果を出すための設定ファイル 他の戦略はもう忘れてください!Grabberだけが、あなたを新たなトレードの高みへと導いてくれるのです。 Grabber戦略の主な特徴: 推奨タイムフレーム:M5〜H4 対応通貨ペア・資産:どれでも使用可能ですが、私が実際に検証した以下を推奨します(GBPUSD、GBPCAD、GBPCHF、AUDCAD、AUDUSD、AUDSGD、AUDCHF、NZDUSD、NZDCAD、EURCAD、EURUSD、E
      Gann Made Easy   は、ミスター・ギャンの理論を使用した取引の最良の原則に基づいた、プロフェッショナルで使いやすい外国為替取引システムです。 W・D・ガン。このインジケーターは、ストップロスとテイクプロフィットレベルを含む正確な買いと売りのシグナルを提供します。 PUSH通知を利用して外出先でも取引可能です。 ご購入後、取引方法の説明と優れた追加インジケーターを無料で入手するには、私にご連絡ください! おそらく、ギャンの取引手法についてはすでに何度も聞いたことがあるでしょう。通常、ギャンの理論は初心者のトレーダーだけでなく、すでにある程度の取引経験がある人にとっても非常に複雑なものです。なぜなら、ギャンの取引手法は理論的にはそれほど簡単に適用できるものではないからです。私はその知識を磨き、最良の原則を私の外国為替インジケーターに組み込むために数年を費やしました。 このインジケーターは非常に簡単に適用できます。必要なのは、それをチャートに添付し、簡単な取引推奨事項に従うだけです。このインジケーターは常に市場分析の仕事を行い、取引の機会を探します。適切なエントリーポイントを検
      BTMM State Engine Pro is a MetaTrader 5 indicator for traders who use the Beat The Market Maker approach: Asian session context, kill zone timing, level progression, peak formation detection, and a multi-pair scanner from a single chart. It combines cycle state logic with a built-in scanner dashboard so you do not need the same tool on many charts at once. What it does Draws the Asian session range; session times can follow broker server offset or be set in inputs. Tracks level progression (L
      Quantum TrendPulse を ご紹介します。これは、   SuperTrend   、   RSI   、および Stochastic のパワーを 1 つの包括的なインジケーターに組み合わせて、取引の可能性を最大限に引き出す究極の取引ツールです。精度と効率を求めるトレーダー向けに設計されたこのインジケーターは、市場のトレンド、勢いの変化、最適なエントリー ポイントとエグジット ポイントを自信を持って特定するのに役立ちます。 主な特徴: SuperTrend 統合: 現在の市場動向に簡単に追従し、収益性の波に乗ることができます。 RSI精度: 買われすぎと売られすぎのレベルを検出し、市場の反転のタイミングに最適で、SuperTrendのフィルターとして使用されます。 確率的精度: 確率的振動を活用して、変動の激しい市場で隠れたチャンスを見つけます。SuperTrend のフィルターとして使用されます。 マルチタイムフレーム分析:   M5 から H1 または H4 まで、さまざまなタイムフレームで市場を常に把握します。 カスタマイズ可能なアラート: カスタム取引条件が満たされ
      トレンド スクリーナー インジケーターでトレンド取引の力を解き放ちます。ファジー ロジックと複数通貨システムを活用した究極のトレンド取引ソリューションです。 ファジー ロジックを活用した革新的なトレンド インジケーターである Trend Screener を使用して、トレンド取引を向上させます。 これは、13 を超えるプレミアム ツールと機能、および 3 つの取引戦略を組み合わせた強力なトレンド追跡インジケーターであり、Metatrader をトレンド アナライザーにする多用途の選択肢となります。 期間限定オファー : トレンド スクリーナー インジケーターは、わずか 65 ドルで生涯ご利用いただけます。 (元の価格 50$ ) (オファー延長) Trend Screener の 100% 非再描画精度の揺るぎない精度を体験して、取引の決定が過去の価格変動の影響を受けないようにしてください。 マルチタイムフレームおよびマルチ通貨機能の多用途性を解放し、比類のない自信を持って外国為替、商品、暗号通貨、インデックスの世界を取引できるようにします。 Trend Screener の包括的な戦
      Meridian Pro
      Ottaviano De Cicco
      5 (1)
      Meridian Pro 2.00:MT5向けプロ仕様マルチタイムフレーム・トレンドマトリクス Meridian Pro 2.00 は、MetaTrader 5 向けのプロ仕様の適応型トレンドマトリクスです。オリジナルの Meridian トレンドエンジン、クリーンなチャート ribbon、確定足ベースのシグナル矢印、8時間足 dashboard、Fuel momentum、weighted consensus、synthetic HTF processing、そしてチャート上に直接表示される上位足コンテキストラインを統合します。 目的はシンプルです。現在のトレンド、マルチタイムフレーム構造、強度、momentum、EA-ready 状態を、複数チャートに無関係なインジケータを重ねるのではなく、1つの整理された workflow で読むことです。 Meridian Pro の違い 1つの適応型エンジン - 同じ volatility-aware Meridian ロジックを M1 から W1 まで適用します。 Synthetic HTF architecture - 上位足行は下位足デ
      ご紹介     Quantum Breakout PRO は 、ブレイクアウト ゾーンの取引方法を変革する画期的な MQL5 インジケーターです。 13年以上の取引経験を持つ経験豊富なトレーダーのチームによって開発されました。     クォンタム ブレイクアウト プロ   は、革新的でダイナミックなブレイクアウト ゾーン戦略により、あなたのトレーディングの旅を新たな高みに押し上げるように設計されています。 クォンタム ブレイクアウト インジケーターは、5 つの利益ターゲット ゾーンを備えたブレイクアウト ゾーン上のシグナル矢印と、ブレイクアウト ボックスに基づいたストップロスの提案を提供します。 初心者トレーダーにもプロのトレーダーにも適しています。 量子EAチャネル:       ここをクリック 重要!購入後、インストールマニュアルを受け取るためにプライベートメッセージを送ってください。 推奨事項: 時間枠: M15 通貨ペア: GBPJPY、EURJPY、USDJPY、NZDUSD、XAUUSD アカウントの種類: ECN、Raw、またはスプレッドが非常に低い R
      OmniSync Projection
      Antonio-alin Teculescu
      5 (1)
      Chronos Fractal Engine is an innovative price projection indicator for MetaTrader 5, designed to transform your technical analysis by intelligently identifying and projecting historical price patterns. Built upon an advanced correlation algorithm and the fractal principles of the market, this powerful tool visualizes potential future price movements, giving you a unique edge in your trading decisions. What is Chronos Fractal Engine? At its core, the Chronos Fractal Engine employs a sophisticat
      このダッシュボードは、選択されたシンボルの最新の利用可能なハーモニックパターンを表示するので、時間を節約し、より効率的に /   MT4バージョン 。 無料インジケーター:   Basic Harmonic Pattern インジケーター列 Symbol : 選択したシンボルが表示されます。 Trend :   強気または弱気 Pattern : パターンの種類(ガートレー、バタフライ、バット、カニ、サメ、サイファー、ABCD) Entry : エントリー価格 SL: ストップロス価格 TP1: 1回目の利食い価格 TP2: 2回目の利食い価格 TP3:   3回目の利食い価格 Current price :   現在値 Age (in bars):    最後に描画されたパターンの年齢 主な入力項目 Symbols:   "28 Major Currency Pairs "または "Selected Symbols "から選択。 Selected Symbols:   カンマで区切られた監視したいシンボル("EURUSD,GBPUSD,XAUUSD")。ブローカーがペアに接
      Azimuth Pro
      Ottaviano De Cicco
      5 (7)
      Azimuth Pro V2:MT5向けシンセティック・フラクタル構造分析と確認済みエントリー 概要 Azimuth Pro は Merkava Labs によるマルチレベルスイング構造インジケーターです。4つのネストされたスイングレイヤー、スイングアンカーVWAP、ABCパターン検出、3タイムフレーム構造フィルタリング、そして確定バーでの確認済みエントリー — 1つのチャートで、ミクロスイングからマクロサイクルまでを網羅するワークフロー。 これはブラインドシグナル製品ではありません。ロケーション、コンテキスト、タイミングを重視するトレーダーのための構造ファーストワークフローです。 V2発売記念オファー — Azimuth Pro V2をUSD 399で(次の100本)。最終価格:USD 499。 1. V2での変更点 シンセティック・マルチタイムフレームエンジン 上位タイムフレーム分析をMeridian Proと同じ独自のシンセティックアーキテクチャで一から再構築。よりクリーンなHTFコンテキスト、安定したライブ動作、従来のMTF同期問題なし。シンセティックエンジンは 固定比率タ
      FX Levels: あらゆる市場における非常に高精度なサポート&レジスタンス 概要 通貨ペア、株式指数、個別銘柄やコモディティなど、どのような市場でも信頼できるサポートとレジスタンスを特定したいですか? FX Levels は伝統的な “Lighthouse” メソッドと先進的な動的アプローチを融合し、ほぼ汎用的な精度を実現します。ブローカーの実務経験を活かし、自動化されたデイリー更新とリアルタイム更新を組み合わせることで、 FX Levels は反転ポイントを見つけ、利益目標を設定し、自信をもってトレードを管理するための手助けをします。今すぐ試してみて、サポート/レジスタンス分析の正確性がどれほどトレードを向上させるかを実感してください! 1. FX Levels がトレーダーにとって非常に有用な理由 非常に正確なサポート&レジスタンスゾーン • FX Levels は異なるブローカー環境でもほぼ同一のゾーンを生成するよう設計されており、データフィードの差異や時刻設定のずれによる不一致を解消します。 • つまり、どのブローカーを利用していても一貫したレベルが得られるため、戦
      まず第一に、この取引ツールはノンリペイント、ノンリドロー、ノンラグの指標であり、プロの取引に理想的ですことを強調する価値があります。 オンラインコース、ユーザーマニュアル、デモ。 スマートプライスアクションコンセプトインジケーターは、新米から経験豊富なトレーダーまで、非常 に強力なツールです。Inner Circle Trader AnalysisやSmart Money Concepts Trading Strategiesなど、20以上の有用な指標を1つに組み合わせています。このインジケーターはスマートマネーコンセプトに焦点を当て、大手機関の取引方法を提供し、彼らの動きを予測するのに役立ちます。 特に、流動性分析に優れており、機関がどのように取引しているかを理解しやすくしています。市場のトレンドを予測し、価格の動きを慎重に分析するのに優れています。機関の戦略とトレードを合わせることで、市場の動向についてより正確な予測ができます。このインジケーターは多目的であり、市場構造を分析し、重要な注文ブロックを特定し、さまざまなパターンを認識するのに優れています。 このインジケーター
      RelicusRoad Pro: 定量的市場オペレーティングシステム 【期間限定】無制限アクセス 70% OFF - 2,000人超のトレーダーと共に なぜ多くのトレーダーは「完璧な」インジケーターを使っても失敗するのでしょうか? それは、文脈を無視して 単一の概念 だけでトレードしているからです。文脈のないシグナルは単なるギャンブルです。勝ち続けるには、 根拠の重なり(コンフルエンス) が必要です。 RelicusRoad Proは単なる矢印インジケーターではありません。完全な 定量的市場エコシステム です。独自のボラティリティモデリングを用いて、価格が推移する「適正価値の道(Fair Value Road)」をマッピングし、ノイズと真の構造的ブレイクを判別します。 推測はやめましょう。機関投資家レベルの「ロード・ロジック」でトレードを。 コアエンジン:「Road」アルゴリズム システムの中心となる Road Algo は、市場環境にリアルタイムで適応するダイナミックなボラティリティチャネルです。 安全ライン(平衡点) と、価格が数学的に反転しやすい 拡張レベル を投影します。 Si
      まず第一に、この取引インジケーターは再描画されず、再描画されず、遅延しないことを強調する価値があります。これにより、手動取引とロボット取引の両方に理想的なものになります。 ユーザーマニュアル:設定、入力、戦略。 アトミックアナリストは、価格の強さとモメンタムを利用して市場でより良いエッジを見つけるためのPA価格アクションインジケーターです。ノイズや誤ったシグナルを除去し、取引ポテンシャルを高めるための高度なフィルターを備えています。複雑なインジケーターの複数のレイヤーを使用して、アトミックアナリストはチャートをスキャンし、複雑な数学的計算をシンプルなシグナルと色に変換します。これにより、どのような初心者トレーダーでも理解して使用し、一貫した取引の決定を行うことができます。 「アトミックアナリスト」は、新規および経験豊富なトレーダー向けにカスタマイズされた包括的な取引ソリューションです。プレミアムインジケーターとトップノッチの機能を1つの取引戦略に組み合わせ、すべてのタイプのトレーダーにとって汎用性のある選択肢にします。 デイリートレーディングとスキャルピング戦略:高速で正確なデイ
      これはMT5のインジケーターで、再描画なしで取引に参入するための正確なシグナルを提供します。 外国為替、暗号通貨、金属、株式、インデックスなど、あらゆる金融資産に適用できます。かなり正確な見積もりを提供し、取引を開始して終了するのに最適な時期を教えてくれます。1つのシグナルを処理しただけでインジケーターの元が取れた例の 動画 (6:22)をご覧ください。Entry PointsPro インジケーターの助けを借りたほとんどのトレーダーの最初の1週間の結果が改善しています。 Telegramグループ に登録してください。Entry Points Proインジケーターのメリットは次の通りです。 再描画のないエントリーシグナル 再描画されるインジケーターでは一度表示されたシグナルが削除されて大きな金銭的損失につながることがありますが、これと異なり、表示されて確認されたシグナルは消えることがありません。 エラーなしの取引開始 インジケーターアルゴリズムによって取引を開始する(資産を売買する)理想的な瞬間を見つけることができます。それを使用するすべてのトレーダーの成功率が向上します。 あら
      Trend Ai indicatorは、トレンドの識別と実用的なエントリポイントと反転アラートを組み合わせることで、トレーダーの市場分析を強化する優れたツールです。 この指標は、ユーザーが自信と正確さで外国為替市場の複雑さをナビゲートすることを可能にします トレンドAiインジケーターは、主要なシグナル以外にも、プルバックやリトレースメント中に発生するセカンダリエントリポイントを識別し、トレーダーが確立されたトレンド内の価格修正を活用できるようにします。 重要な利点: *MT4およびMT5の仕事 *明確な買いまたは売りシグナル *再描画しません ·すべての資産で動作します 私はeaやセットをtelegram it詐欺で販売しないように注意してください。 すべての設定はここでブログで無料です。  重要! 指示とボーナスを得るために購入後すぐに私に連絡してください! 私の他のプロダクトと同様、実質操作の監視はここに見つけることができます: https://www.mql5.com/en/users/mechanic/seller&nbsp ; 設定および入力: すべての
      Market Structure Order Block Dashboard MT5 は、市場構造と主要な価格反応ゾーンをチャート上で直接読み取りたいトレーダー向けに設計された MT5 インジケーターです。BOS、ChoCH、オーダーブロック、Fair Value Gap (FVG)、流動性、Kill Zones、Volume Profile、そして素早い分析のためのコンパクトなダッシュボードを組み合わせています。 本インジケーターは、市場構造、ICT、Smart Money の概念を意思決定の枠組みとして使用するトレーダーを対象としています。トレンド継続、反転の可能性、価格の不均衡、流動性ターゲット、注目ゾーンをより構造的に特定する助けとなります。 購入者向けの付属リソース 購入後、MQL5 のプライベートメッセージにてご依頼いただくと、完全な PDF ユーザーガイドとパラメータ設定のヒントを提供いたします。MQL5 のプライベートメッセージによる直接的な技術サポート。 バージョン 1.20 では 2 つの重要な追加機能があります: Pending BOS / Pending Cho
      まず正直に言いましょう。 どんなインジケーターも、それ単体であなたを利益化させることはできません。もしそう言う人がいるなら、それは夢を売っているだけです。完璧な売買シグナル(矢印)を表示するインジケーターは、いくらでも“完璧に見せる”ことができます。正しい過去の区間を拡大して、勝ちトレードだけを切り取ればいいだけです。私たちはそれをしません。 SMC Intraday Formula はツールです。 市場構造を読み取り、最も高い確率の価格ゾーンを特定し、今この瞬間のスマートマネーの痕跡をシンプルな言葉で正確に示します。最終判断はあなたが行います。トレードを実行するのもあなたです。しかし今は「希望」ではなく「精度」でエントリーできます。 私たちはこのインジケーターを、ゴールド(XAUUSD)および主要FX通貨ペアで約3年間、日々のスキャルピングに使用してきました。M1、M5、M15、M30の主要ツールです。これは未来を予測しようとするのではなく、今まさに形成されている高確率セットアップを示し、その理由を説明します。 他のすべてのインジケーターと何が違うのか? ほとんどのトレーディングイ
      Smart Stop Indicator – チャート上で実現するインテリジェントなストップロス精度 概要 Smart Stop Indicator は、ストップロスを勘や感情ではなく、明確で体系的に設定したいトレーダーのために設計されています。本ツールは、クラシックなプライスアクション(高値更新・安値切り下げ)と最新のブレイクアウト認識ロジックを組み合わせ、次に来るべき論理的なストップレベルを正確に特定します。トレンド相場、レンジ、急速なブレイクアウト局面のいずれであっても、最適な SL ゾーンとその状態(“new”、“broken”、“valid”)をチャート上に直接表示します。さらに今回、SL 距離の %ADR 表示も新たに追加されています。 主な特徴 マーケット構造に基づく自動ストップ配置 • 市場構造とリアルタイムの値動きに基づき、意味のあるストップロスレベルを自動検出します。 スマートなブレイクアウト感知 • 急激な方向転換やブレイクアウトにも柔軟に対応し、早すぎるストップ調整を避けます。 SL %ADR の表示 • ストップロスまでの距離を ADR(Averag
      Crystal Heikin Ashi Signals - Professional Trend & Signal Detection Indicator Advanced Heikin Ashi Visualization with Intelligent Signal System for Manual & Automated Trading Final Price: $149 ---------> Price goes up $10 after every 10 sales . Limited slots available — act fast . Overview Crystal Heikin Ashi Signals is a professional-grade MetaTrader 5 indicator that combines pure Heikin Ashi candle visualization with an advanced momentum-shift detection system. Designed for both manual traders
      ARICoin is a powerful trading companion designed to generate high-probability entry signals with dynamic TP/SL/DP levels based on volatility. Built-in performance tracking shows win/loss stats, PP1/PP2 hits, and success rates all updated live. Key Features: Buy/Sell signals with adaptive volatility bands Real-time TP/SL/DP levels based on ATR Built-in MA Filter with optional ATR/StdDev volatility Performance stats panel (Success, Profit/Loss, PP1/PP2) Alerts via popup, sound, push, or email Cust
      Market Structure Patterns
      Samuel Manoel De Souza
      4.47 (19)
      Market Structure Patterns   is an indicator based on   smart money concepts   that displays   SMC/ICT   elements that can take your trading decisions to the next level. Take advantage of the   alerts ,   push notifications   and   email messages   to keep informed from when an element is formed on the chart, the price crosses a level and/or enters in a box/zone. Developers can access the values of the elements of the indicator using the   global variables  what allows the automation of trading
      IX Power MT5
      Daniel Stein
      4.92 (13)
      IX Power: 指数、商品、暗号資産、外国為替市場の洞察を発見 概要 IX Power は、指数、商品、暗号資産、外国為替市場の強弱を分析するための多用途ツールです。 FX Power が全ての利用可能な通貨ペアデータを活用して外為ペアで最高の精度を提供する一方、 IX Power は基礎資産の市場データにのみ焦点を当てています。この特性により、 IX Power は非外為市場に最適であり、単純な外為分析にも信頼性の高いツールです。どのチャートでもスムーズに機能し、取引判断を向上させるための明確で実行可能な洞察を提供します。 1. IX Power がトレーダーにとって価値がある理由 複数市場での強弱分析 • IX Power は指数、商品、暗号資産、外為シンボルの強弱を計算し、それぞれの市場に合わせた洞察を提供します。 • US30、WTI、ゴールド、ビットコイン、または通貨ペアなどの資産を監視して取引機会を発見できます。 幅広い市場に適応 • 外為取引では、 FX Power が関連する全ての通貨ペアを分析することで比類のない精度を提供します。 • IX Power
      作者のその他のプロダクト
      BeST_Oscillators Collection is a Composite MT5 Indicato r including the Chaikin ,  Chande and TRIX Oscillators from which by default Chaikin and TRIX Oscillators but not Chande Momentum Oscillator are contained in MT5 platform. It also provides for each Oscillator the option of displaying or not a Mov. Average as a  Signal Line and the resulting Signals as Arrows in a Normal (all arrows) or in a Reverse Mode (without showing up any resulting successive and of same type arrows). Analytically fo
      FREE
      BeST_Gann Hi-Lo Strategy is an MT4 indicator that is based on the Gann Hi-Lo Activator the famous trend-following indicator that allow us to to enter a trade quite early while also stay in a trade as longer as we can for taking profit.While it is built of a moving average it helps traders determine the direction of the trends and to produce with-trend trading signals. This indicator is in fact a simple moving average of the highs and lows of the previous period. It follows the trends in the mark
      FREE
      BeST_Darvas Boxes is a Metatrader Indicator based on the trading method developed in the 50’s by the Hungarian Nicolas Darvas . BeST_Darvas Boxes indicator draws the Top and the Bottom of every Darvas Box that can be confirmed on the current Chart draws Buy and Sell Arrows for every confirmed Upwards or Downwards Breakout of the above levels draws always only after the bar closing and so is non-repainting or backpainting it can be used as a standalone trading system/method Inputs Basic Settin
      BeST Oscillators Collection is a Composite MT4 Indicator including the  Chaikin,Chande  and TRIX Oscillators which by default are contained in  MT5  but not in  MT4 platform. It  also provides  the option of displaying or not a Mov. Avg. as a Signal   Line and the resulting Signals as Arrows in a Normal (all arrows) or in a Reverse Mode (without showing up any resulting successive and of same type arrows). Analytically for each one of the specific Oscillators: The Chaikin Oscillator ( CHO )   is
      FREE
      BeST_Darvas Boxes EA is an MT4  Expert Advisor that is based on the most classic trading method developed  in the 50's by Nicolas Darvas  commonly known as The Darvas Boxes Trading System. The Original Darvas Boxes System can be found in details in his book "How I Made $2,000,000 In The Stock Market"  (Copyright 1960, by Nicolas Darvas). Although the original system was designed to trade only Stocks and to open only Long trades its trading principles can also be applied to many other Markets l
      Variable Index Dynamic Average (VIDYA) developed by Tushar Chande  by default is contained in MT5 but not in MT4 platform and it is a dynamic EMA (Exponential Moving Average) that adjusts its Length (LB Period) automatically in response to Market Volatility originally measured through the Chande Momentum Oscillator(CMO). CMO value is used as the ratio to the smoothing factor of EMA ( The New Technical Trader by Tushar Chande and Stanley Kroll, John Wiley and Sons, New York, 1994). The higher th
      FREE
      BeST DEMA
      Eleni Koulocheri
      4.5 (2)
      Double Exponential Moving Average ( DEMA ) is a moving  average (MA) that gives the most weight to recent price data.Like exponential moving average (EMA), it is more reactive to all price fluctuations than a simple moving average (SMA) and so DEMA can help traders to spot reversals sooner, because it is faster responding to any changes in market activity. DEMA was developed by Patrick Mulloy in an attempt to reduce the amount of lag time found in traditional MAs. ( TASC_Feb. 1994 ). DEMA can al
      FREE
      BeST_ Classic Pivot Points is an MT4 Indicator that is based on the widely known and definitely classic Pivot Point of a market prices activity. A pivot point is calculated as an average of significant prices (high,low,close) from the performance of a market in the prior trading period. If the market in the following period trades above the pivot point it is usually evaluated as a bullish sentiment, whereas trading below the pivot point is seen as bearish. A pivot point and the associated suppo
      FREE
      BeST_Chande RAVI (Range Action Verification Index) is an MT4 Indicator that is based on the corresponding indicator developed by Tushar Chande which is mainly based on market momentum while focuses on identifying ranging and trending markets. By default RAVI is defined by the formula:  RAVI = Absolute value (100 x (SMA(7) – SMA(65)). Also by default there is an arbitrary reference level of 3% that means a market is ranging if the RAVI is less than 3%, or trending strongly if it is is greater th
      FREE
      Triple Exponential Moving Average ( TEMA ) is a  moving   average (MA) that gives the  most weight to recent price data. TEMA is more reactive to  all price fluctuations than  a Simple Moving Average (SMA) or an Exponential Moving Average (EMA) or even a Double Moving Average (DEMA) and surely can help traders to spot reversals sooner because it responds very fast to any changes in market activity.  TEMA was developed by Patrick Mulloy in an attempt to reduce the amount of lag time found in trad
      FREE
      BeST_Darvas Boxes is an MT4  Indicator based on the trading method developed in the 50’s by the Hungarian Nicolas Darvas . BeST_Darvas Boxes indicator draws the Top and the Bottom of every Darvas Box  that can be confirmed on the current Chart. draws Buy and Sell Arrows  for every confirmed Upwards or Downwards Breakout of the above levels. draws always only after the bar closing and so is non-repainting or backpainting . Note : Every customer who wants to have the older version v_1.75 with th
      BeST_Fibonacci Retracement Lines is an MT4 Indicator that by default is based on common  Fibonacci levels but it can also draw any 3 desired levels of Retracement or Support of a trending move. It can be used to identify pullback points but also additionally as a kind of a Trailing Stop . BeST_Fibonacci Retracement Lines indicator: • by default draws 38.2%, 50% and 61.8% Retracement Levels of the current price move defined using the Highest High (HH) and Lowest Low (LL) of a desired Look Back Pe
      BeST_Visual MAs Signal Generator  MT4 Indicator is a very  useful Visual Tool that can display in the Chart all ENTRY signals (BUY and SELL) and also any corresponding EXIT signal, based on a total of 12, common but also different trading strategies, in which the Entry and Exit Signals are derived exclusively by using Moving Averages (MAs). The two main groups of MAs Strategies included in this tool are: A) Crossover Signals This group includes 4 different strategies (A1-A4), where Entry and Exi
      BeST_Keltner  Channels Variations & Strategies   is an   MT4  Indicator based on the original  Keltner Channels Technical Analysis Indicator and it is a very useful Visual Tool that can display in the Chart all the known Variations of Keltener Channels and also the corresponding 10 totally Strategies   i.e. all ENTRY signals (BUY and SELL) and also any corresponding EXIT signal, in which the Enrty and Exit Signals are derived exclusively by using Keltner Channels Variations. Every variation of K
      BeST_Trend  Scanner is an MT4 Indicator that uses a proprietary algorithm   in order to identify the most likely levels and probable moment for an upside  or a downside trending price move. BeST_Trend  Scanner is a very useful tool that defines in advance and with a high statistical percentage of accuracy the subsequent Resistance & Support Levels of the anticipated upside or downside trending move of price and so When used at its Reverse Entries Mode : It generates Buy or Sell arrows at the ver
      BeST_Chande TrendScore Indicator  points the start of a trend with high degree of  accuracy and it is amazing for scalping on the 1min timeframe. It is also a   simple way to rate trend strength. It indicates both the direction and strength  of a trend and can be easily combined with various trend-following, swing and scalping strategies. As of a trend’s direction and strength a value of +10 signals a strong uptrend while a value of -10 signals a strong downtrend. Generally a positive score show
      All those involved in trading do certainly know that Moving Average Crossovers for being tradable should be reliable and also they need to have minimal lag. BeST_Vervoort Zero Lagging MAs Strategy is a Metatrader Indicator that can help you to achieve it and is based on S.Vervoort's work about Reliable and of Zero Lag MAs Crossovers as described in his TASC_05/2008 article " The Quest For Reliable Crossovers ". It's a Multipotentiality Indicator as it can display of either simply the Zero Laggin
      BeST_Trend Exploiter is a Metatrader Indicator  based on a smart proprietary algorithm which can detect the market Median Trend while it filters out the noise providing Buy and Sell Signals and also wherever it is applicable it provides us with TP Levels of High Probability. Additionally as it has Built Inside all the necessary features it can be used as a Complete Strategy of very Impressive Results. Essential Advantages of the Indicator Clear and Easily Understandable trading rules. Real Time
      BeST_IFT of Oscillators Collection is a Composite MT4 Indicator   that is based on the IFT (Inverse Fisher Transformation) applied to RSI , CCI , Stochastic and DeMarker Oscillators in order to find the best Entry and Exit points while using these Oscillators in our trading. The IFT was first used by John Ehlers to help clearly define the trigger points while using for this any common Oscillator ( TASC – May 2004 ). All Buy and Sell Signal s are derived by the Indicator’s crossings of the Buy or
      BeST_123 Strategy is clearly based on the 123_Pattern which is a frequent Reversal Chart Pattern of a very high Success Ratio . It occurs at the end of trends and swings and it’s a serious indication of high probability for a change in trend. Theoretically an 123_pattern is valid when the price closes beyond the level of #2 local top/bottom, a moment when the indicator draws an Entry Arrow,  raises an Alert and a corresponding Position can be opened. The BeST 123_Strategy Indicator is non-repai
      BeST_Profit Taker Exits is a Metatrader Indicator based on the corresponding vital part of Jim Berg's Trading System.It timely locates the most likely points/bars of significant Profit Taking and can be easily used as an add-on to any Trading System/Method . The Indicator consists of 2 Take Profit lines deriving as (MA ± times the ATR) usually the upper one above the prices (for Long Trades) and the lower one below prices (for Short Trades). When the Close (or High by choice) of a bar is above
      BeST_Hull MAs Directional Strategy is a Metatrader Indicator based on the corresponding Hull Moving Average.It timely locates the most likely points for Entering the Market as well as the most suitable Exit points and can be used either as a standalone Trading System or as an add-on to any Trading System for finding/confirming the most appropriate Entry or Exit points. This indicator does use only the directional slope and its turning points of Hull MAs to locate the Entry/Exit points while it a
      BeST_Breakout Strategy is a Metatrader Indicator based on a proprietary algorithm implementing a very powerful tool that can exploit every breakout leading to huge market movements. It timely locates the most likely points for Entering the Market as well as the most suitable Exit points and can be used successfully as a standalone Trading System which often results in huge profits accompanied by very impressive statistics like Success Ratio and Profit Factor.  The BeST_Breakout Strategy is a
      BeST_ Elliot Wave Oscillator Strategies is an MT4 indicator which by default is the difference of two SMAs displayed as a histogram fluctuating around zero while a Signal Line generates Entry Signals either in a Reverse or in a Normal Mode and it is a very powerful tool that very often exploits huge market movements. Signal Line comes in 2 types: Advanced Get Type – like the corresponding one used in the homonym analysis package Mov. Average Type – as a Moving Average of the Elliot Oscillator I
      BeST_Keltner Channels Strategies  EA   is an MT4  Expert Advisor that is based on the method developed by Chester W. Keltner described in book “How To Make Money in Commodities” that  Keltner called it the ten-day moving average trading rule. Originally Keltner Channels uses for Central Line a 10-bars SMA of Typical Price and  the 10-bars Average Range (High - Low) with a multiplication factor of 1 for constructing the Boundary Bands. Later several known traders and authors have published modif
      BeST_RevEngEMARSI Strategy is an MT4 Indicator that is based on the indicator RevEngEMARSI by Giorgos Siligardos that was presented in his article " Reverse Engineering RSI (II) " ( TASC_Aug 2003 ) as a new variation of his inverse-RSI indicator and which transforms the Exponential moving average of RSI into a curve in the price graph, simplifying the price projection method and improving its visual representation. BeST_RevEngEMARSI Strategy while implementing the crossings with its Moving Aver
      BeST_ADX Scalping Strategy is an MT4 Strategy of an Entry and Exit Signals Indicator based on the ADX values that is an excellent tool for scalpers to scalp the currency market multiple times a day for profit . It is built mainly for scalping purposes although it can also be used as a breakout indicator . Its Signals produce a complete and standalone trading system of impressive results . The indicator comes with a new enhanced Real Time Updated Info and Statistics Panel that can improve its ove
      BeST_RMO Indicator Strategies is an MT4 Indicator that is based on the corresponding famous Oscillator created by Rahul Mohindar that detects trends in all markets and it can produce Buy and Sell Signals of high winning probability forming a complete and standalone trading system of impressive results. The indicator uses 2 strategies as a selection: i) Classic : produces Reversed Entry Signals by the crossings of zero (0) line  and ii) MAsSignals : produces Reversed Entry Signals using MAs of RM
      BeST_Fisher Oscillator Strategies is an MT4 Indicator that is based on the popular Fisher Indicator and it is mainly used to identify trend reversals with a high accuracy .  It is a great forex trading indicator for scalping , day trading and swing trading purposes. The indicator comes with 2 corresponding Strategies of Reversed Entries each one of which can be used either as a standalone Trading System or as an add-on to any Trading System for finding or confirming the most appropriate Entry o
      BeST_Hull MAvgs Strategies_EA is an MT4 Expert Advisor based on the Market indicator named  BeST_Hull MAs Directional Strategy  and can make trades according to it or using only 1 HMA while it also applies all common Trade and Risk Management features. Generally the Hull Moving Average (HMA - developed by Alan Hull) is a directional trend indicator. It captures the current state of the market and uses recent price action to determine if conditions are bullish or bearish relative to historical da
      フィルタ:
      Joan Carlos Rosario Nunez
      515
      Joan Carlos Rosario Nunez 2025.09.02 17:03 
       

      ¡Excelente indicador! Muy fácil de instalar y configurar. Las flechas BUY/SELL y las alertas (popup/push/sonido) funcionan perfecto; las señales se confirman al cierre y no repintan. Me gustó la tabla de info en tiempo real y las variantes de Keltner. En mis primeras pruebas (BTCUSD/EURUSD, H1) la lectura de tendencia y las reentradas fueron claras y útiles. ¡Gracias por la calidad y el precio justo! Consulta: ¿existe un **EA** que opere directamente con las señales de este indicador (o alguna integración recomendada)? Y si por la compra hay algún **bonus** (presets/plantillas extra o descuento en otro producto), con gusto lo recibiría. ¡Gracias de antemano!

      レビューに返信