Rapid
- Indikatoren
- Version: 1.23
- Aktualisiert: 24 Juli 2024
- Aktivierungen: 7

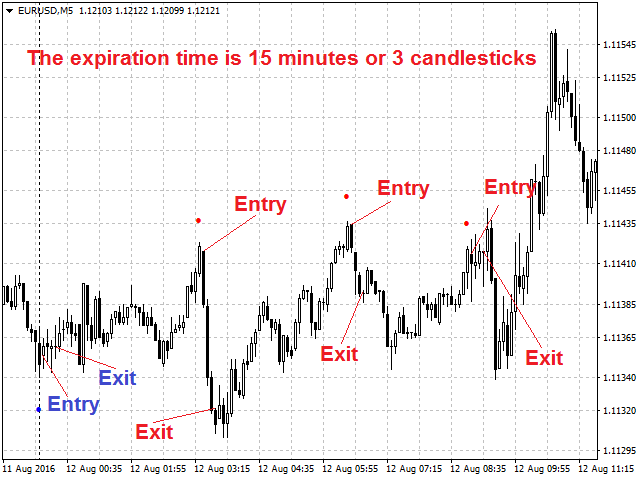
Der Rapid Indikator ist ein fertiges Handelssystem für binäre Optionen. Das System ist für den Handel auf einem Fünf-Minuten-Intervall mit dem 15-Minuten-Ablauf und mit der Auszahlung von mindestens 85%, ist es für Händler mit Web-Terminals und MetaTrader 4-Plattform entwickelt. Verfügbare Finanzinstrumente: EURUSD, EURCHF, GBPUSD, GBPJPY, USDJPY und XAGUSD.
Es handelt sich um ein Counter-Trend-System, d.h. es wartet auf die Preisumkehr eines gehandelten Assets.
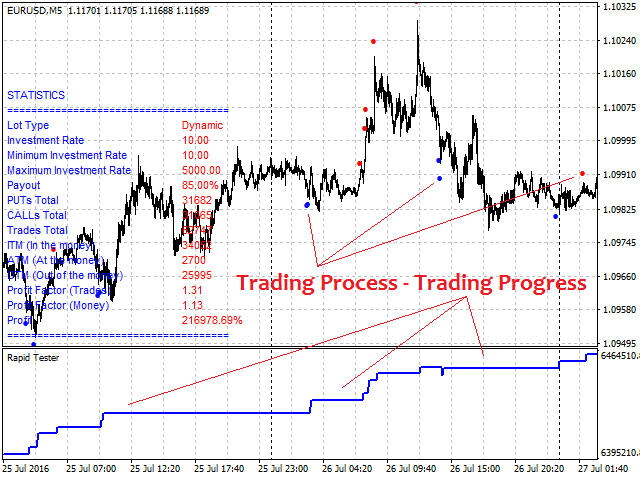
Die Indikatorsignale werden nicht neu gezeichnet, sondern erscheinen nach dem Schließen eines Balkens und sind mit einem akustischen Signal versehen. Um eine bessere Entscheidungsfindung zu ermöglichen, stellt das System dem Benutzer die berechneten statistischen Informationen auf der Grundlage der verfügbaren historischen Daten für ein Instrument zur Verfügung, wobei der kostenlose einfache Systemtester - Rapid Tester - als Indikator implementiert ist.
Dazu sind mindestens 100 historische Balken erforderlich.
Eingaben
- Call Arrow Type - Typ der Call-Handelsanzeige.
- Put-Pfeil-Typ - Typ der Put-Handelsanzeige.
- Beep Type - Typ des akustischen Alarms:
- Alert - Warnung.
- Ton - Ton.
- Ton abspielen - Tonalarm:
- true - verwenden.
- false - nicht verwenden.
- Sprache der Meldungen - Sprache der Meldungen:
- Englisch
- Russisch
verwenden
Handeln Sie auf der Grundlage offener Kurse unter Verwendung der Indikatorsignale.
Der Indikator kann für den manuellen oder automatischen Handel innerhalb eines Expert Advisors verwendet werden. Für den automatisierten Handel kann er Pufferwerte des Indikators vom Doppeltyp verwenden: 0 - verkaufen, 1 - kaufen. Die Werte sollten nicht gleich Null sein!
Der automatisierte Handel ist mit dem Rapid Expert möglich.
Empfehlungen
Es wird empfohlen, Broker mit einer hohen Auszahlungsquote von 85% oder mehr und mit einer geringen Latenzzeit bei der Handelsausführung auf dem Handelsserver zu wählen.