ABC Trend Levels Pro MT5
- Indikatoren
- Version: 6.100
- Aktivierungen: 5

Beschreibung
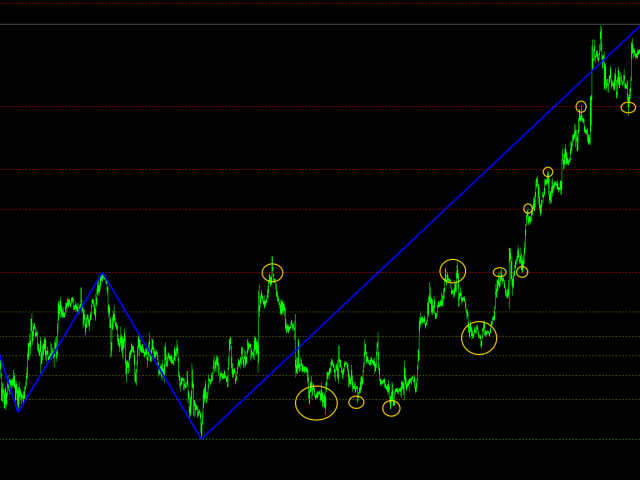
ABC Trend Levels Pro ist ein Indikator, der Markttrends und wichtige Trendunterstützungs- und Widerstandsebenen identifiziert.
Empfehlungen
Sie können diesen Indikator verwenden, um den Trend zu bestimmen und dementsprechend die Richtung der Eröffnung einer Position oder der Schließung einer entgegengesetzten Position zu bestimmen.
Parameter
===== _INDICATOR_SETTINGS_ ===== - Indikatoreinstellungen
Maximum History Bars - maximale Anzahl von History Bars für die Berechnung des Indikators.
Average True Range Period - Periode des ATR-Indikators (wird zur Berechnung der Differenz zwischen gleitenden Durchschnitten verwendet).
Schnelle gleitende Periode - Periode des schnellen gleitenden Durchschnitts.
Langsam gleitende Periode - Periode des langsam gleitenden Durchschnitts.
Movings Difference - Mindestdifferenz zwischen gleitenden Durchschnitten (für die Impulssuche), ausgedrückt in der Anzahl der ATR-Werte.
Impuls-Boost-Level - Boost-Level des Impulses.
Wendepunkt-Korrektur - Korrektur des Wendepunkts.
A-Welle Erstellungsart - Erstellungsart der Welle A.
B-Welle Erstellungsart - Erstellungsart der Welle B.
Vic-Linie verwenden - Vic-Sperandeo-Linie verwenden.
===== _GRAPHICS_SETTINGS_ ===== - Grafikeinstellungen
Trend Lines Color - Farbe der Trendlinien.
Breite der Trendlinien - Breite der Trendlinien.
Unterstützungslinien Farbe - Farbe der Unterstützungslinien.
Middle-Level Lines Color - Farbe der Middle-Level-Linien.
Widerstandslinien Farbe - Farbe der Widerstandslinien.
Level-Linien Breite - Breite der Level-Linien.