ABC Trend Levels Pro MT5
- 指标
- 版本: 6.100
- 激活: 5

Description
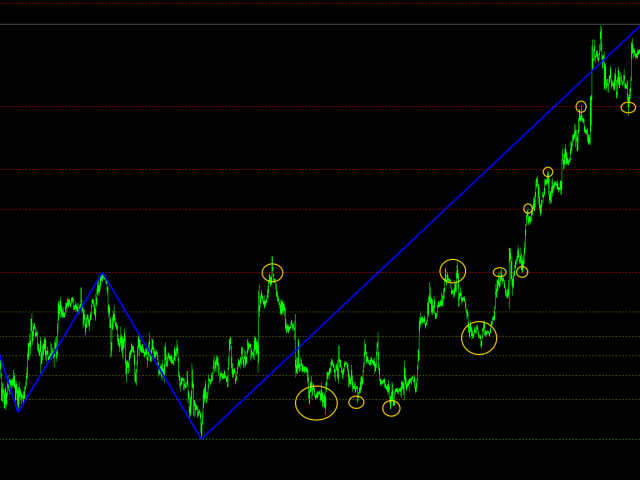
ABC Trend Levels Pro is an indicator that identifies market trends and important trend support and resistance levels.
Recommendations
You can use this indicator to determine the trend and, accordingly, to determine the direction of opening a position or closing an opposite position.
Parameters
===== _INDICATOR_SETTINGS_ ===== - indicator settings
Maximum History Bars - maximum number of history bars for calculating the indicator.
Average True Range Period - ATR indicator period (used to calculate the difference between moving averages).
Fast Moving Period - period of the fast moving average.
Slow Moving Period - period of the slow moving average.
Movings Difference - minimum difference between moving averages (for searching impulses) expressed in the number of ATR-values.
Impulse Boost Level - boost level of impulse.
Turn Point Correction - correction of turn point.
A-Wave Create Type - creation type of wave A.
B-Wave Create Type - creation type of wave B.
Use Vic Line - use Vic Sperandeo line.
===== _GRAPHICS_SETTINGS_ ===== - graphics settings
Trend Lines Color - color of trend lines.
Trend Lines Width - width of trend lines.
Support-Level Lines Color - color of support-level lines.
Middle-Level Lines Color - color of middle-level lines.
Resistance-Level Lines Color - color of resistance-level lines.
Level Lines Width - width of level lines.