New Age Indicator
- Indikatoren
- Version: 5.5
- Aktualisiert: 23 Mai 2020
- Aktivierungen: 5

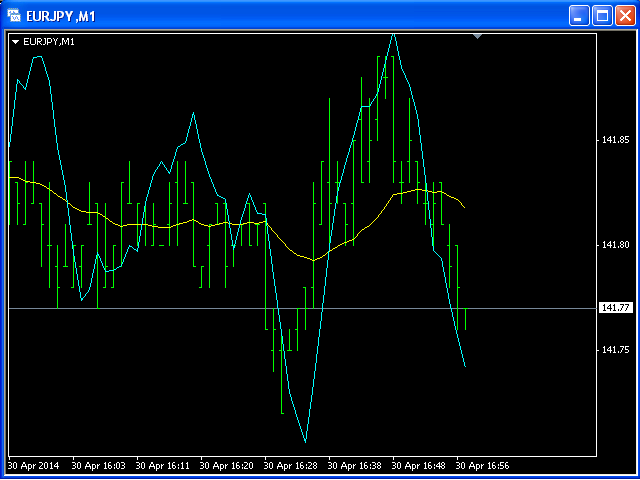
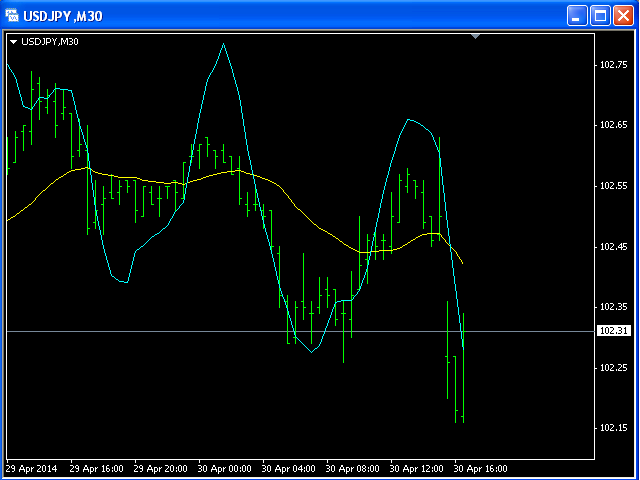
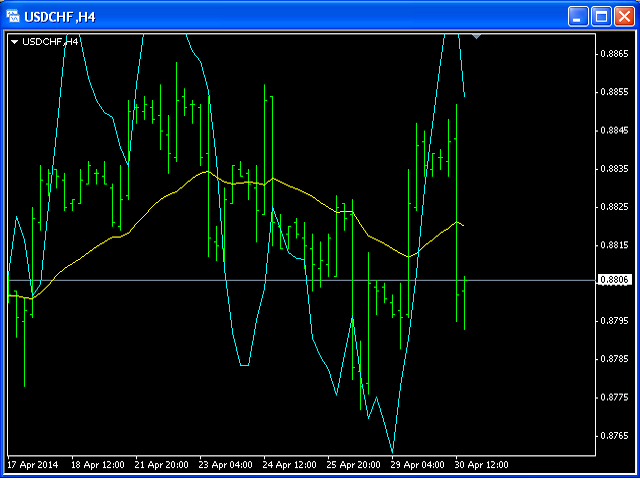
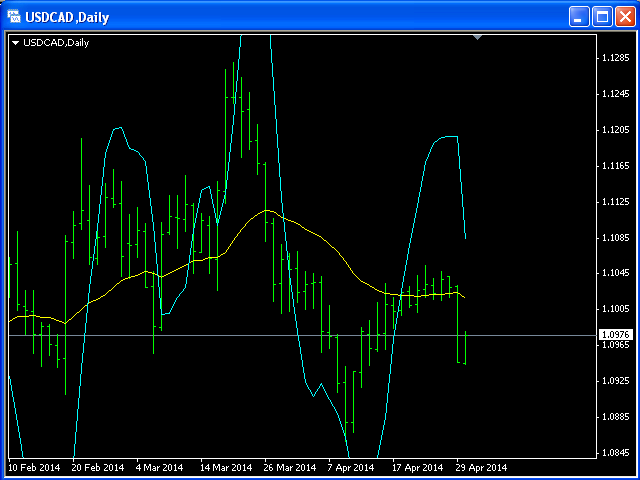
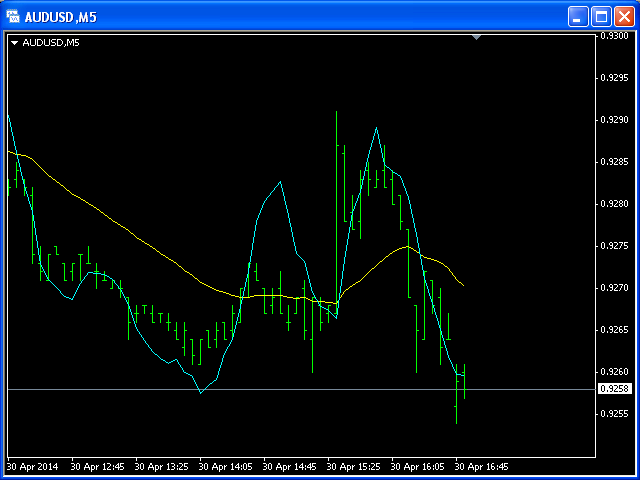
Selbsterklärender Indikator: Kaufen, wenn die Aqua-Linie die gelbe Linie nach oben kreuzt und Verkaufen, wenn die Aqua-Linie die gelbe Linie nach unten kreuzt.
Eingabeparameter:
- Zeitraum1 = 13.
- Methode1 = 2. MODE_SMA=0, MODE_EMA=1, MODE_SMMA=2, MODE_LWMA=3.
- Zeitraum2 = 5.
- Methode2 = 0. MODE_SMA=0, MODE_EMA=1, MODE_SMMA=2, MODE_LWMA=3.